
The Big Dream
$100 million of First Nations owned food security infrastructure
- 01Executive summary
- 02The problem, by design
- 03The response: infrastructure, owned
- 04Pillar 1: The Road
- 05Pillar 2: The Sea
- 06Pillar 3: The Precinct
- 07Capital plan
- 08Ten year financial summary
- 09Social return
- 10Risks
- 11Governance
- 12Staged rollout
- 13Appendices
How to read the numbers
This document holds itself to one discipline above everything else. Every figure is labelled.
Verified means the figure comes from a primary source: an audited report, a regulator's publication, a government dataset, a peer reviewed study. Each one is cited in the research reference library.
Derived means the figure is calculated from verified inputs and the method is stated. Example: the roughly $9.18 per kilogram cost of wet season airfreight, derived from Community Enterprise Queensland's audited totals.
Indicative means the figure is a planning estimate awaiting quotes. Nothing indicative is presented as firm, and nothing indicative should be read as firm.
The commercial numbers that matter most in this market are not public. No operator publishes freight rates for these lanes. No manufacturer publishes Australian list prices for battery electric prime movers. Vessel prices are broker asking prices until a survey is done. Where a number does not yet exist, this document says so, and Year 0 budgets the work of obtaining it. Funders should treat that honesty as a feature of the plan, not a gap in it.
Executive summary
More than half of remote First Nations households were food insecure through lack of money in the most recent national survey. Not because food cannot reach them. Because of what it costs by the time it does. A nine item grocery basket that costs $44.70 in a capital city supermarket costs $99.38 on average in a remote community store, peaking at $110.82. A healthy food basket costs up to 50 per cent more in Cape York than in Brisbane. In the Torres Strait, prices run 35 to 40 per cent above the mainland and freight alone adds more than 14 per cent to the cost of goods sold. All verified. All current.
These prices are not weather. They are architecture. Almost every kilogram of food eaten in these communities moves through a single freight operator, which the competition regulator recorded in June 2026 as the sole supplier of regular scheduled sea freight on most routes in Far North Queensland and the Northern Territory. When the price protections attached to its 2016 merger expired, rates rose 14.5 per cent, then 8.9 per cent, with fuel levies peaking at 57 per cent. The subsidy programs meant to soften those prices flow through the same chokepoint. The communities own none of it.
The Big Dream is the structural answer: $100 million, invested once, in food security infrastructure that First Nations communities will own. Three pillars, one system.
| Pillar | Ask | What it is |
|---|---|---|
| The Road | $21.0M | A battery electric refrigerated freight corridor, Brisbane to Cairns, staged north |
| The Sea | $31.0M | Two community controlled vessels breaking the sea freight monopoly, scaled from the Masig pilot |
| The Precinct | $38.0M | A Gold Coast food, logistics, training and energy campus that anchors the group's earned revenue |
| Capability, consultation, contingency | $10.0M | Community mandate first, IFF capability build, insurance reserve, program contingency |
| Total | $100.0M |
The scale of the ask is honest about the scale of the problem. Total direct government expenditure on Aboriginal and Torres Strait Islander Australians was $33.4 billion in 2015 to 16, the most recent national estimate (verified). $100 million is roughly 0.3 per cent of one year of that spend (derived). Yet it exceeds any single federal remote food security program of the past three years, and approaches all of them combined, which total roughly $153 million (derived from verified items). One structural investment, at a fraction of the recurring cost of managing the problem.
The financial model is presented plainly as a model. Earned revenue is projected to cover group operating costs in full by year ten, with roughly $35.7 million of annual revenue across sea freight, road freight, catering and food products, accommodation, training, tenancies and energy (modelled, indicative). At scale the group supports 100 to 140 direct roles, majority First Nations, including 20 First Nations MC licensed drivers and a maritime crewing pathway (targets, derived from the model).
Why now. Four dated facts converge. On 12 June 2026 the ACCC accepted a court enforceable undertaking from Sea Swift that strips the exclusive dealing and matching right clauses that blocked every previous entrant (verified). Queensland's remote freight subsidy is reported to fall from $29.4 million to $4.4 million in 2026 to 27 (reported from Budget papers; to be verified against Budget Paper 4). Battery electric prime movers began rolling off Volvo's Wacol production line in Brisbane in July 2026 (verified). And there is still no food security target among the 19 Closing the Gap measures (verified). The door to structural competition is open now. Doors like this close.
Indigenous Futures Foundation leads. IFF is a registered charity with deductible gift recipient status, working with named partners: Love Ya Corporate Catering as trading arm, Providence Education (RTO application in progress), Fortified & Co, and The Established Ventures. Nothing is built without a documented community mandate. Community equity flows through CATSI corporations as pillar assets localise. The capital plan is a blended stack: philanthropic cornerstone, concessional debt, energy co funding, corporate partners and state co investment, drawn down in stages against decision gates.
This is not a program. It is infrastructure and ownership. Programs end when funding ends. Infrastructure compounds.
The problem, by design
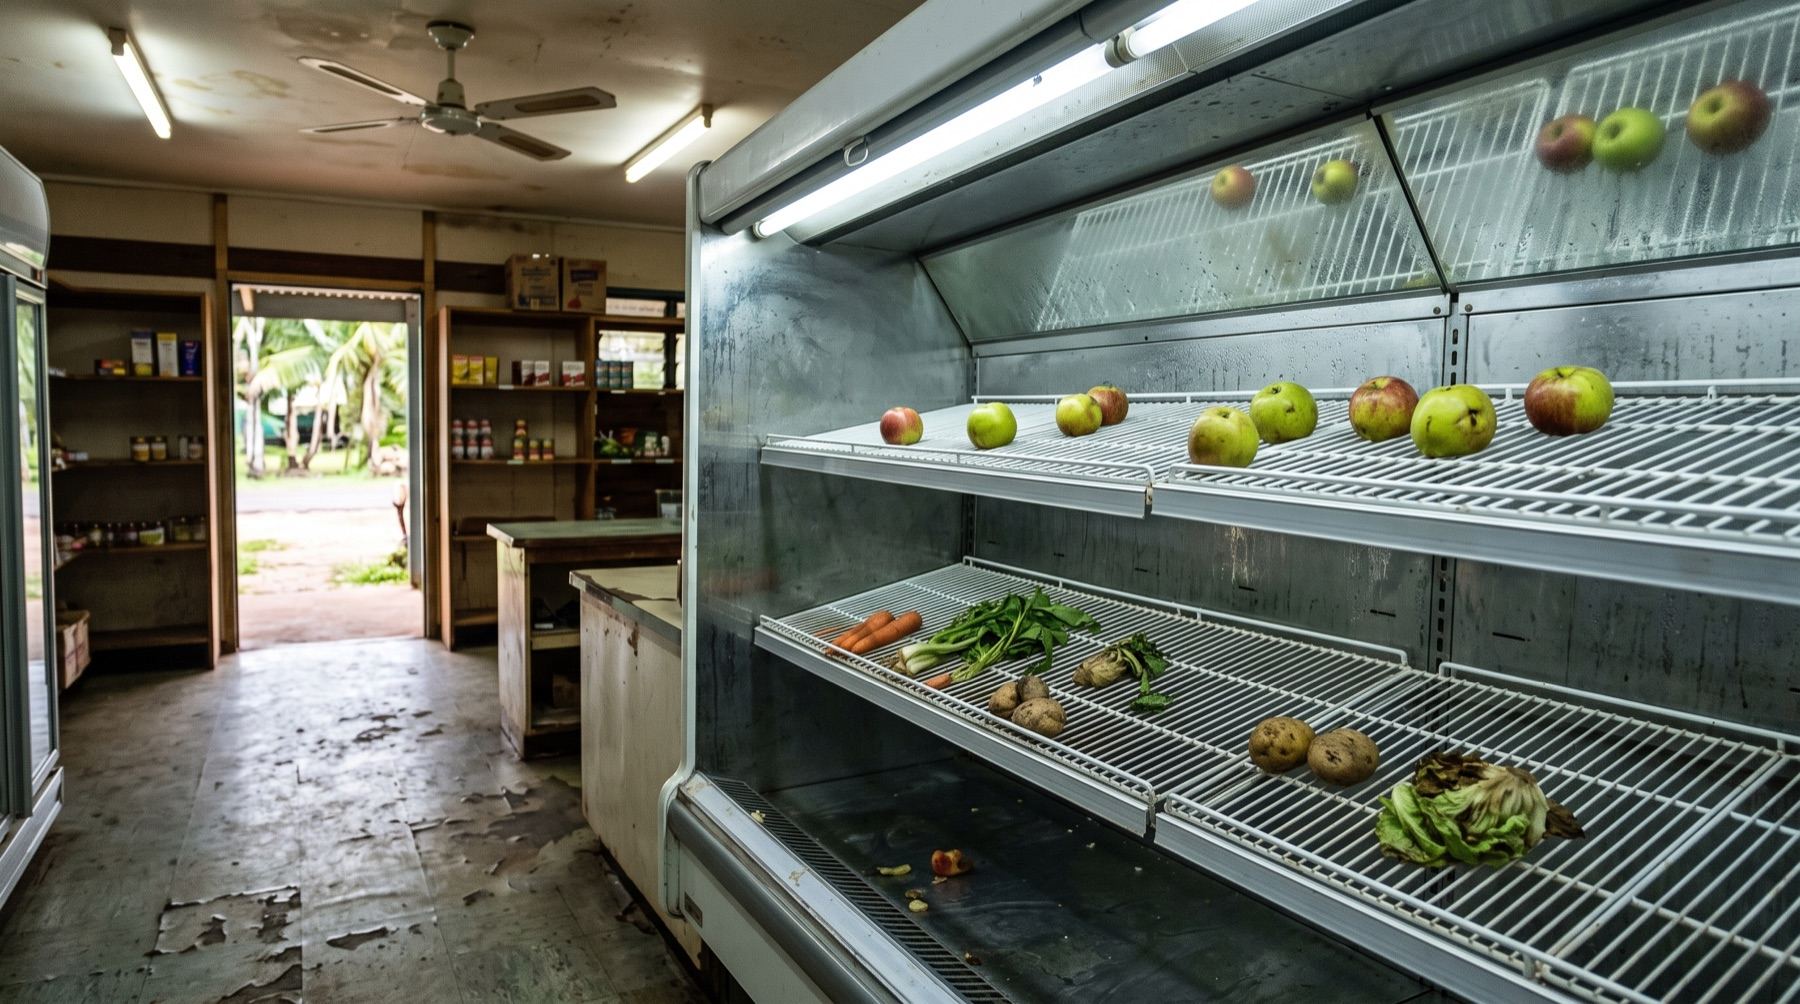 Before
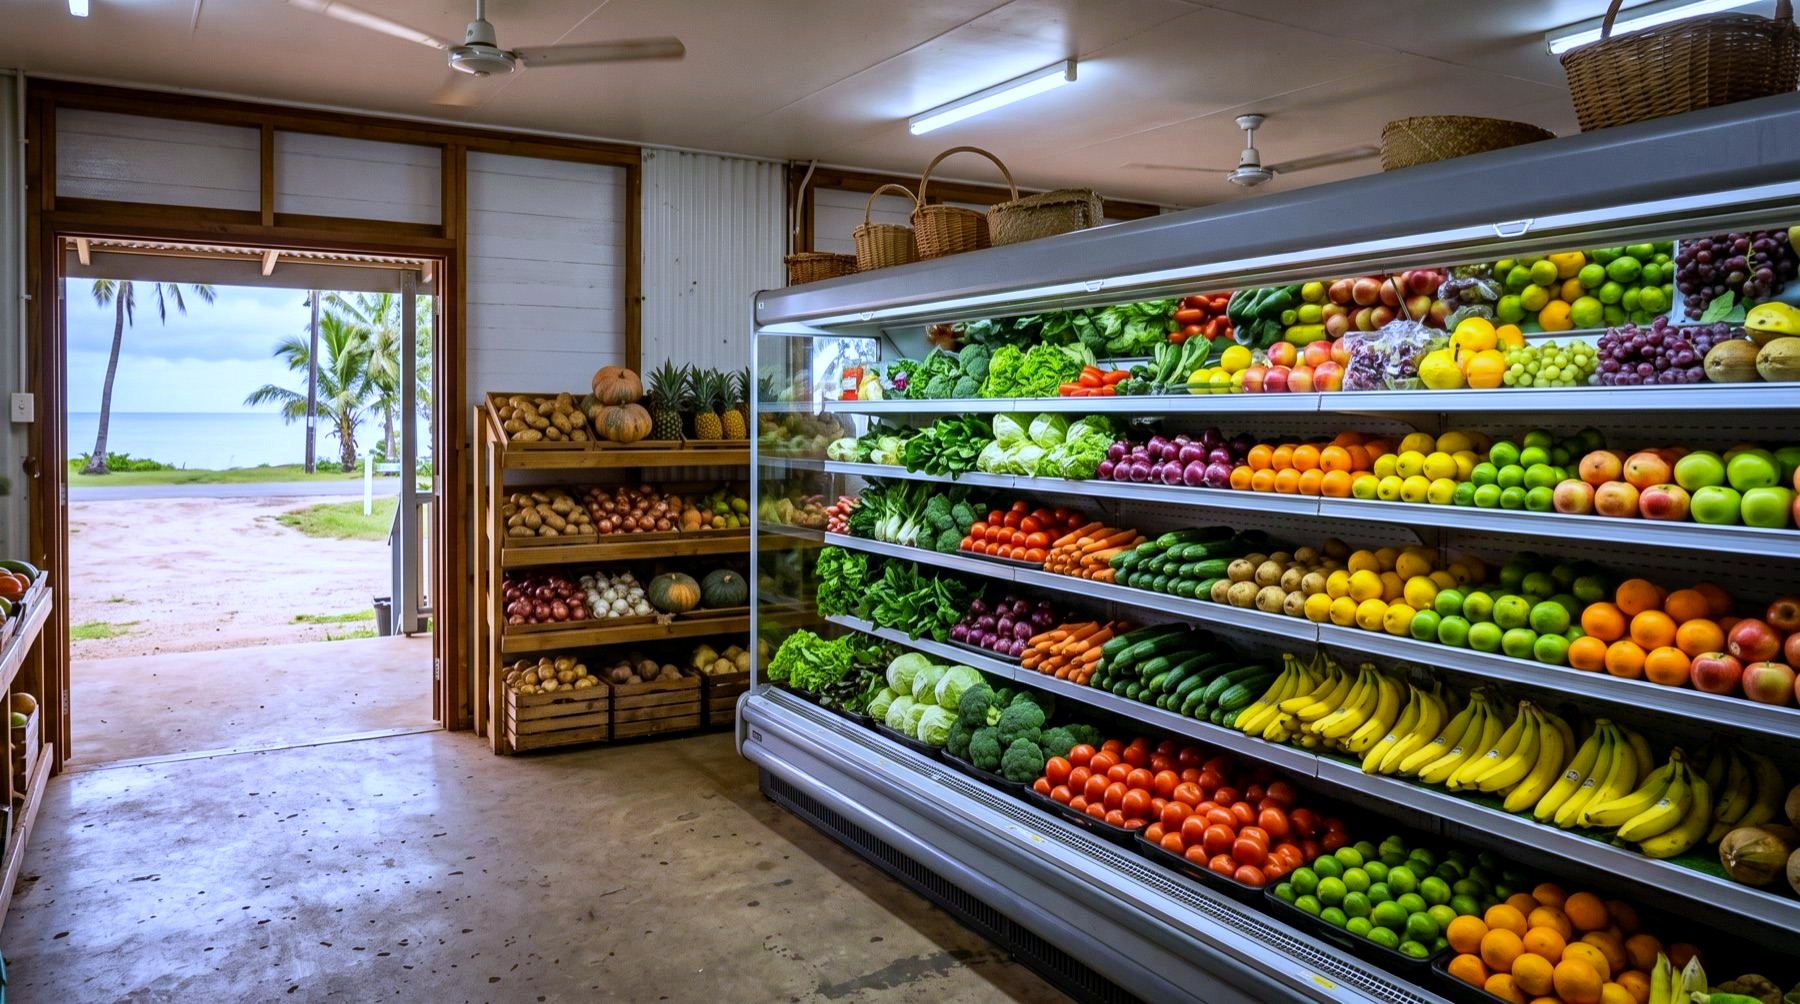 After
AfterThe problem is best understood as a loop. Public money flows out as food security funding, moves through subsidy programs and community stores, and is consumed by freight charged through a monopoly chokepoint controlled by a government owned investment corporation, with the value flowing on to institutional capital. The communities the funding is meant to serve stand outside the circuit. They own no link in the chain.
I'm not describing corruption. I'm describing procurement design.
Hunger by Design, Chapter 1
The book from which this business case grows, Hunger by Design, maps the loop in six links. Government funds food security programs. Programs subsidise food costs and support community stores. Food moves through a single freight operator, because there is no alternative. Community stores pay full commercial freight rates, so the subsidy passes through the retail layer and concentrates at the freight layer. Freight revenue flows into the owner's infrastructure fund. And the government controls the monopoly while the returns flow to capital. Each link is reasonable in isolation. In sequence they form a closed circuit that generates activity, reports and freight revenue, and no First Nations wealth.
The money goes out. The value flows to capital. The government holds both ends.
Hunger by Design, Chapter 1
The monopoly is not a rhetorical device. It is a documented arc. Before 2016 this market had two operators, and the ACCC's own merger review records that they had been engaged in a price war for roughly two years. Rates were held down by competition, in this exact market, within the past decade (verified). The Australian Competition Tribunal then authorised the merger over the ACCC's opposition, with price caps and service conditions that ran about five years. The caps expired around mid 2021. Rates rose 14.5 per cent in September 2022 and 8.9 per cent in September 2023, and the fuel levy peaked at 57 per cent in 2022 (verified). In September 2019 QIC's Global Infrastructure Fund had paid just under $300 million for 100 per cent of the operator (verified). By September 2025 the ACCC recorded it as the sole supplier of regular scheduled sea freight on most routes in the region, and on 12 June 2026 it accepted a court enforceable undertaking removing the contract clauses that had locked customers in (verified). The undertaking amends contracts. It does not touch ownership. The architecture stands.
What monopoly pricing looks like on an invoice is worth one concrete example. ALPA's evidence to the ACCC documents the fuel levy alone running at 5 to 10 per cent in 2021, reaching as high as 57 per cent in 2022, and settling at 27 to 31 per cent in 2024: a $400 base pallet rate becomes $524 before the goods leave the wharf (verified). Vonda Malone, chief executive of the Torres Strait Regional Authority, told the Queensland parliamentary inquiry of backlogs of six to eight weeks at times, because there is one provider (verified). None of this is new knowledge. The first parliamentary inquiry into remote community stores reported in 2009. An audit in 2014 found one of five desired actions completed. A further inquiry in 2020 found very high food costs. In 2024 alone, a state inquiry, the ACCC and the national audit office each documented the same structural problem from a different angle. Report after report, and the architecture remains.
What the architecture produces is measurable, and every figure in the table below is verified.
| Stat | Value | Source |
|---|---|---|
| Remote First Nations households food insecure | 51% (41% national) | ABS NATSIHS 2022 to 23 |
| Nine item basket, capitals vs remote | $44.70 vs $99.38 (peak $110.82) | CHOICE, October 2024 |
| Cape York healthy food basket vs Brisbane | up to 50% higher | Health and Wellbeing Queensland, 2022 |
| Torres Strait prices vs mainland | 35 to 40% higher; freight adds 14%+ | V Malone, TSRA, Qld Select Committee, 2024 |
| Food bought at the community store | 90 to 95% | HoR inquiry 2020; ALPA ACCC submission 2024 |
| Freight share of goods cost, barge served stores | up to 39% (vs 9% road served) | ALPA ACCC submission 2024 |
| Sea Swift sole supplier finding | sole supplier of scheduled sea freight on most NT and FNQ routes since September 2025; court enforceable undertaking 12 June 2026 | ACCC |
| Post cap price rises | 14.5% (September 2022), 8.9% (September 2023); fuel levy peaked at 57% (2022) | Cape York Weekly; ALPA and ACCC |
| QIC acquisition of Sea Swift | just under $300M for 100%, September 2019 | AFR and QIC announcements |
| Kowanyama, 2024 to 25 wet season | 27 weeks isolated; $1.86M airfreight for 202,825 kg (about $9.18 per kg, derived) | CEQ Annual Business Review 2024 to 25 |
| Diabetes | 3.2 times prevalence, 4.0 times death rate vs non Indigenous | AIHW |
| Queensland 20% freight discount effect | remote healthy diet costs fell 24% within a year; scheme funding reported to fall from $29.4M to $4.4M in 2026 to 27 | IJERPH 2026; Qld budget reporting (verify Budget Paper 4) |
| Addressable population | ~16,800 people (about 9,200 mainland Cape York and NPA, plus about 7,500 Torres Strait) | Derived from ABS 2021 QuickStats |
Two rows in that table deserve a moment. The Kowanyama row shows what seasonal isolation costs when the only fallback is aircraft: 27 weeks cut off, 202,825 kilograms flown in, $1.86 million spent, roughly $9.18 for every kilogram of food and essentials (derived from CEQ's audited review). The diabetes row shows where the costs finally land. People die of these prices. First Nations people die from diabetes at four times the non Indigenous rate. When the affordable food that survives a long freight chain is processed and shelf stable, the health outcomes are not a mystery. They are an infrastructure outcome.
And the accountability machinery does not see any of it. The National Agreement on Closing the Gap contains 19 measures. Not one of them measures whether First Nations people can afford to eat (verified). Food security has no target, no dashboard, no annual reporting line. What is not measured is not funded, and what is not funded stays exactly as it is.
None of this is an accusation against the people inside the system. Store managers, policy writers, procurement officers and fund managers each see their own link clearly and act in good faith within it. The problem is that no one is required to see the chain. This business case exists because IFF looked at the whole chain and drew the only conclusion available: the loop will not be consulted away, inquired away or subsidised away. It has to be owned differently.
The response: infrastructure, owned
The theory of change is short. Remote food prices are dominated by freight, and freight is priced by a monopoly. Where this market briefly had two operators, competition held prices down; that is the regulator's record, not our hope. So the response is to build the second operator, and to make sure that this time the infrastructure belongs to the communities it serves. Freight is the wedge. Ownership is the point. Around that wedge, the group builds the things that make an infrastructure owner durable: a production and logistics precinct that earns commercial revenue, an energy layer that cuts the largest operating cost, and a training pipeline that staffs the assets with First Nations drivers, crews, growers and cooks.
The difference between subsidy and infrastructure is this: a subsidy manages disadvantage. Infrastructure builds capacity. A subsidy needs to be renewed every budget cycle. Infrastructure compounds. A subsidy is a line item in someone else's budget. Infrastructure is an asset on your own balance sheet.
Hunger by Design, Chapter 1
Why $100 million. Because the ask is sized to the architecture, not to a program guideline. Two vessels with a war chest sized for an incumbent price response. A ten truck electric corridor with its own charging. A precinct large enough to carry the group to earned self sufficiency. A serious consultation budget and honest contingency. The components are itemised in Section 7 and priced in the costings workbook, where every line carries a source and a confidence rating. For scale: $100 million is about 0.3 per cent of one year of direct government expenditure on Aboriginal and Torres Strait Islander Australians ($33.4 billion in 2015 to 16, the most recent national estimate; verified, with the share derived). It is also larger than any single itemised federal remote food security commitment of 2023 to 2026, and approaches the whole set combined at roughly $153 million (derived from verified items). Governments have spent generously on managing the symptom. This is the price of changing the structure once.
Why now. Four verified facts, all dated within the past thirteen months.
- The regulatory door is open. The ACCC's court enforceable undertaking of 12 June 2026 removes the exclusive dealing and matching right clauses that stopped any rival winning enough customers to become viable. Customers are free to move for the first time in a decade. Entrants are few. The first credible one through the door sets the market's new shape.
- The subsidy is falling away. Queensland's Remote Communities Freight Assistance Scheme funded a 20 per cent register discount, and remote healthy diet costs fell 24 per cent within a year of the increase (verified, peer reviewed). Scheme funding is reported to fall from $29.4 million to $4.4 million in 2026 to 27 (reported; verification against Budget Paper 4 is a Year 0 task). The relief communities felt is about to shrink. A structural alternative is needed before the cliff, not after it.
- The technology has arrived, in Brisbane. Volvo began building battery electric trucks at Wacol in July 2026, with a next generation lineup rated to about 470 kilometres of range and up to 65 tonnes gross combination mass (verified). The energy economics favour electric decisively, about $39 against $80 per 100 kilometres in a 2026 published comparison (verified). The fleet this case proposes would be built an hour up the road from the depot it departs from.
- The measurement gap persists. No food security target sits among the 19 Closing the Gap measures (verified). Nothing in the official architecture will fix this by itself. The change has to be built from outside it, and then held up as the proof that forces the measure.
Where this sits against national policy. The Commonwealth released its ten year National Strategy for Food Security in Remote Aboriginal and Torres Strait Islander Communities in March 2025, built on seven pillars and grounded in genuine community consultation (verified). This plan lands squarely on three of those pillars: Remote Retail, Supply Chains and Healthy Economies. What the strategy lacks is capital at the scale of the structure it describes; its initial Commonwealth funding was $11.8 million (verified). Canada offers the contrast: its Nutrition North retail subsidy runs at C$144.8 million every single year (verified), a permanent payment for a problem that stays permanent. A one off $100 million in community owned infrastructure is the structural alternative to both: aligned with the national strategy's direction, and built so the spending ends because the problem does.
What the response is not. It is not a charity food program, and it does not treat communities as recipients. Communities are the owners this plan exists to serve, the decision makers whose mandate gates every stage, and over time the equity holders of the assets themselves. It is not a subsidy replacement either; the group will tender into subsidy and government freight channels where they exist, but the model must stand on earned revenue, and the ten year plan is built on that basis. And it is not a bet on a single asset. Three pillars share customers, energy, depots and a balance sheet, so that no single contract, season or price response can break the whole.
Pillar 1: The Road
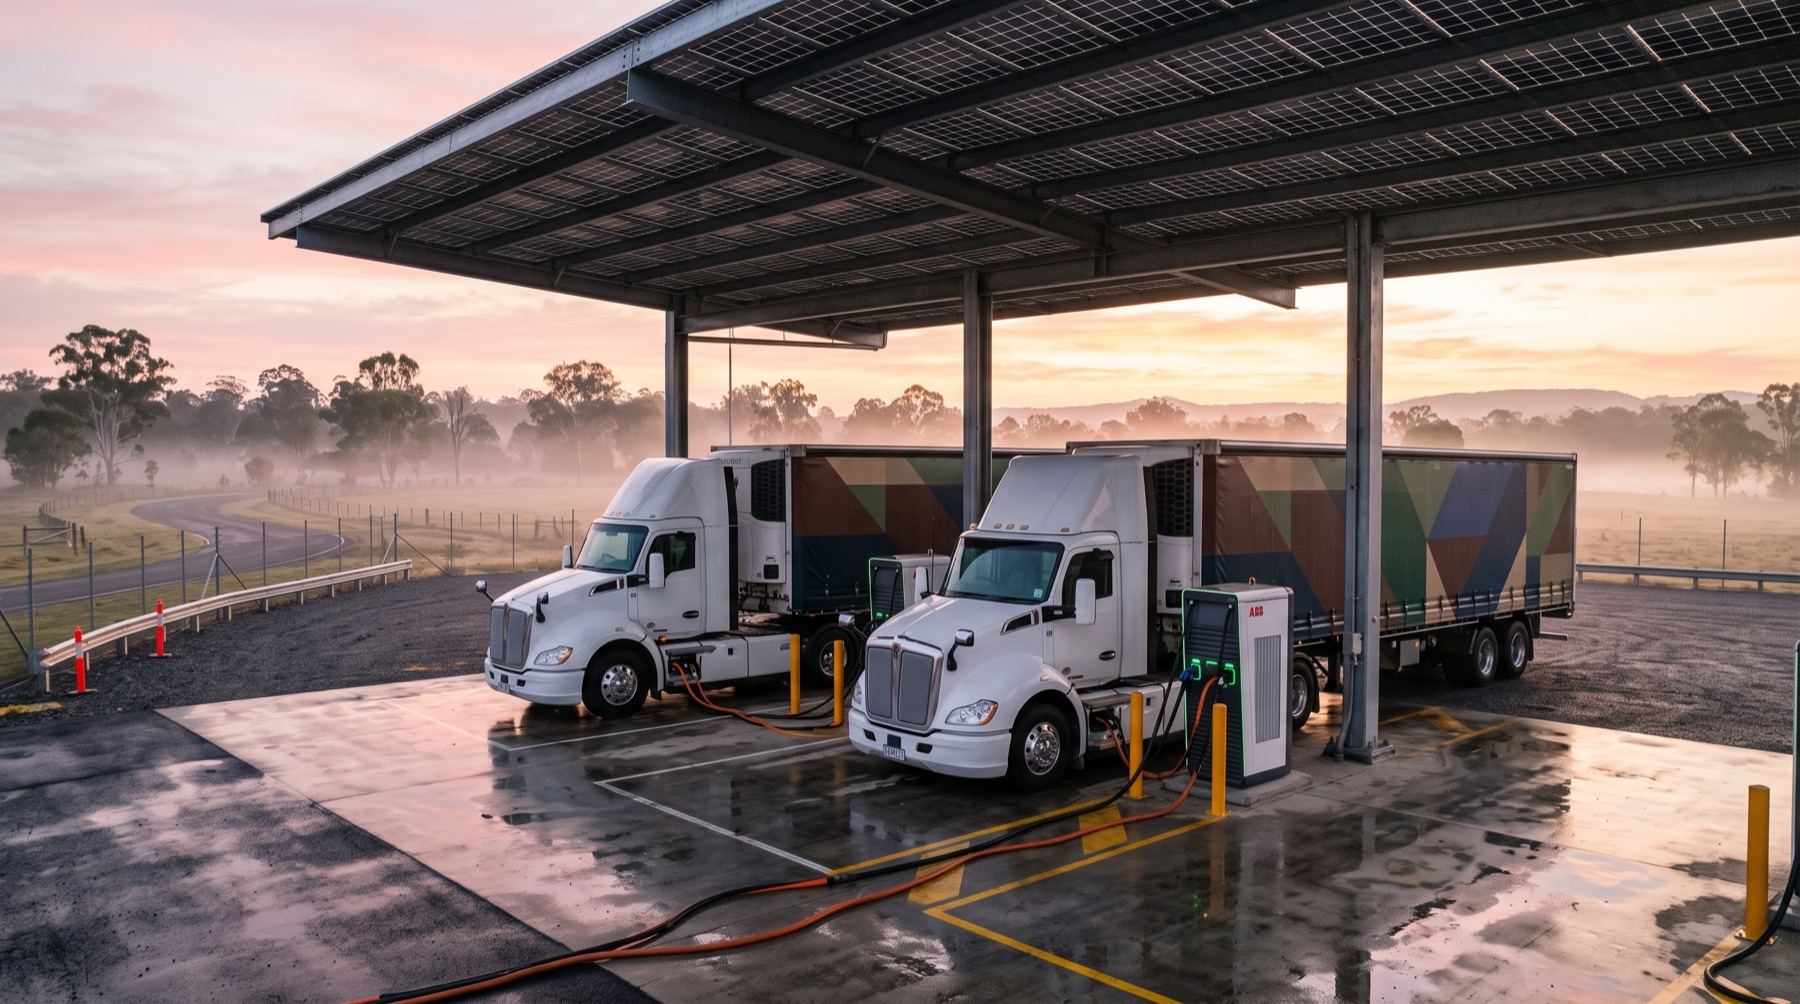
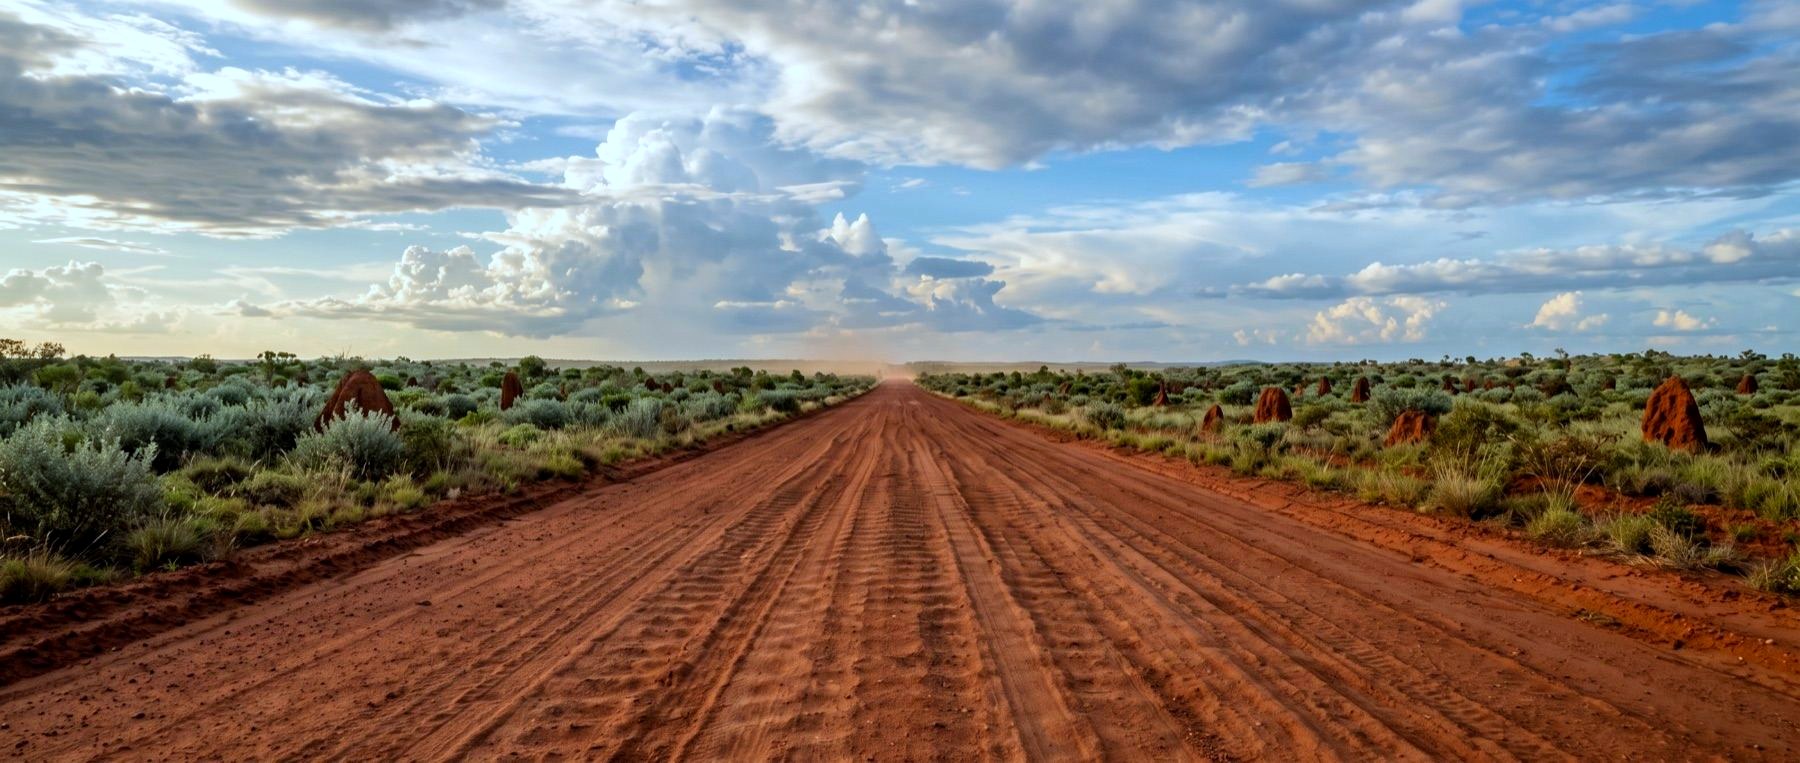
Every pallet of fresh food that reaches Cape York starts its journey on the same 1,673 kilometres of the Bruce Highway between Brisbane and Cairns, hauled by diesel, priced by diesel, and marked up at every handling point after it. The Road pillar puts that trunk route under First Nations ownership with a battery electric refrigerated fleet built about an hour up the road from our own depot, powered substantially by our own solar, and driven by a pipeline of First Nations drivers trained through the group's own RTO pathway as it comes online. It is the pillar with the most proven technology, the clearest cost advantage, and the shortest path to revenue. And it is staged honestly, because the road north of Cairns is not yet a road you can promise on.
The staged model. The research is blunt: battery electric linehaul to the tip of Cape York is not currently feasible year round, and this case is stronger for saying so.
- Stage 1 (years 1 to 3). Brisbane to Cairns electric corridor. 1,673 kilometres via the Bruce Highway (verified, TMR), with two to three charging stops. The anchor vehicle is the Volvo FH Electric, built at Wacol in Brisbane since July 2026, with the next generation rated to about 470 kilometres of range and up to 65 tonnes gross combination mass (verified). Energy cost runs about $39 per 100 kilometres against about $80 for diesel in a 2026 published Australian comparison (verified). Refrigerated trailers carry electric refrigeration units so the cold chain draws from the battery and the depot solar, not a diesel donkey engine.
- Stage 2 (years 2 to 4). Cairns north, intermodal, cold chain guaranteed. Door to store: electric linehaul to Cairns, then the group's own vessels (Pillar 2) or road north as the season allows. The Peninsula Developmental Road will still have roughly 145 kilometres unsealed after the $237.5 million Cape York Region Package Stage 2 (verified, TMR), and wet season closures are real and recorded: Kowanyama was isolated for 27 weeks in the 2024 to 25 wet season (verified, CEQ audited review). The design answer is intermodal resilience, not bravado. Because the wet season leg runs on our own hulls, the cold chain guarantee does not depend on the incumbent.
- Stage 3 (end state). Electric onto the PDR as sealing and charging allow. Full electrification to the Cape is the ambition that names this pillar. It is stated as ambition, not promise, and it advances only as the road, the grid and the fleet technology do.
Fleet and capex. All figures indicative unless marked; benchmarks and sources sit in the costings workbook.
| Item | Cost | Basis |
|---|---|---|
| 10 battery electric prime movers | $4.8M | About $480k each, market estimate; no OEM publishes Australian list prices. Written quotes are a Year 0 task |
| 12 refrigerated trailers with electric refrigeration units | $2.7M | Trailer market signals; unit pricing quote only |
| Southern charging hub at the precinct | $2.5M | ARENA co funded hub projects as benchmark |
| Cairns depot and charging hub | $5.5M | Depot plus charging; Cairns industrial property benchmarks |
| En route charging at two partner sites | $3.0M | Partner siting reduces land cost; grid studies commissioned early |
| First Nations driver pipeline | $1.0M | Licensing, training, mentoring across three years |
| Spares and fleet contingency | $1.5M | Fleet availability protection |
| Total | $21.0M |
What the rates rest on. Lane rate cards remain quote only, and Year 0 budgets obtaining them. Until then the model is framed by published benchmarks rather than guesses: Victoria’s statutory owner driver schedule puts a six axle semi trailer’s variable costs at 179 cents per kilometre; the Commonwealth’s transport appraisal tables put vehicle operating costs at 116 to 124 cents per kilometre on flat rural roads and about triple that at steep grades; BITRE’s standing benchmark is about 9 cents per net tonne kilometre for interstate non bulk freight; and the Commonwealth itself legislates a 10 per cent refrigerated premium in the Tasmanian Freight Equalisation Scheme. Every one of these is in the reference library with a primary citation.
Charging. There is no dedicated heavy vehicle charging on the Bruce Highway today; every announced Australian truck charging hub is in Melbourne (verified as an absence in ARENA and TMR listings, and flagged as such). That gap is an opportunity as much as a cost. The corridor plan pairs the two owned hubs at each end with en route charging at two partner sites, is a natural candidate for ARENA co funding under its heavy vehicle program, and books grid connection studies with the network operator as a Year 0 task, because connection timelines, not hardware, are the real schedule risk.
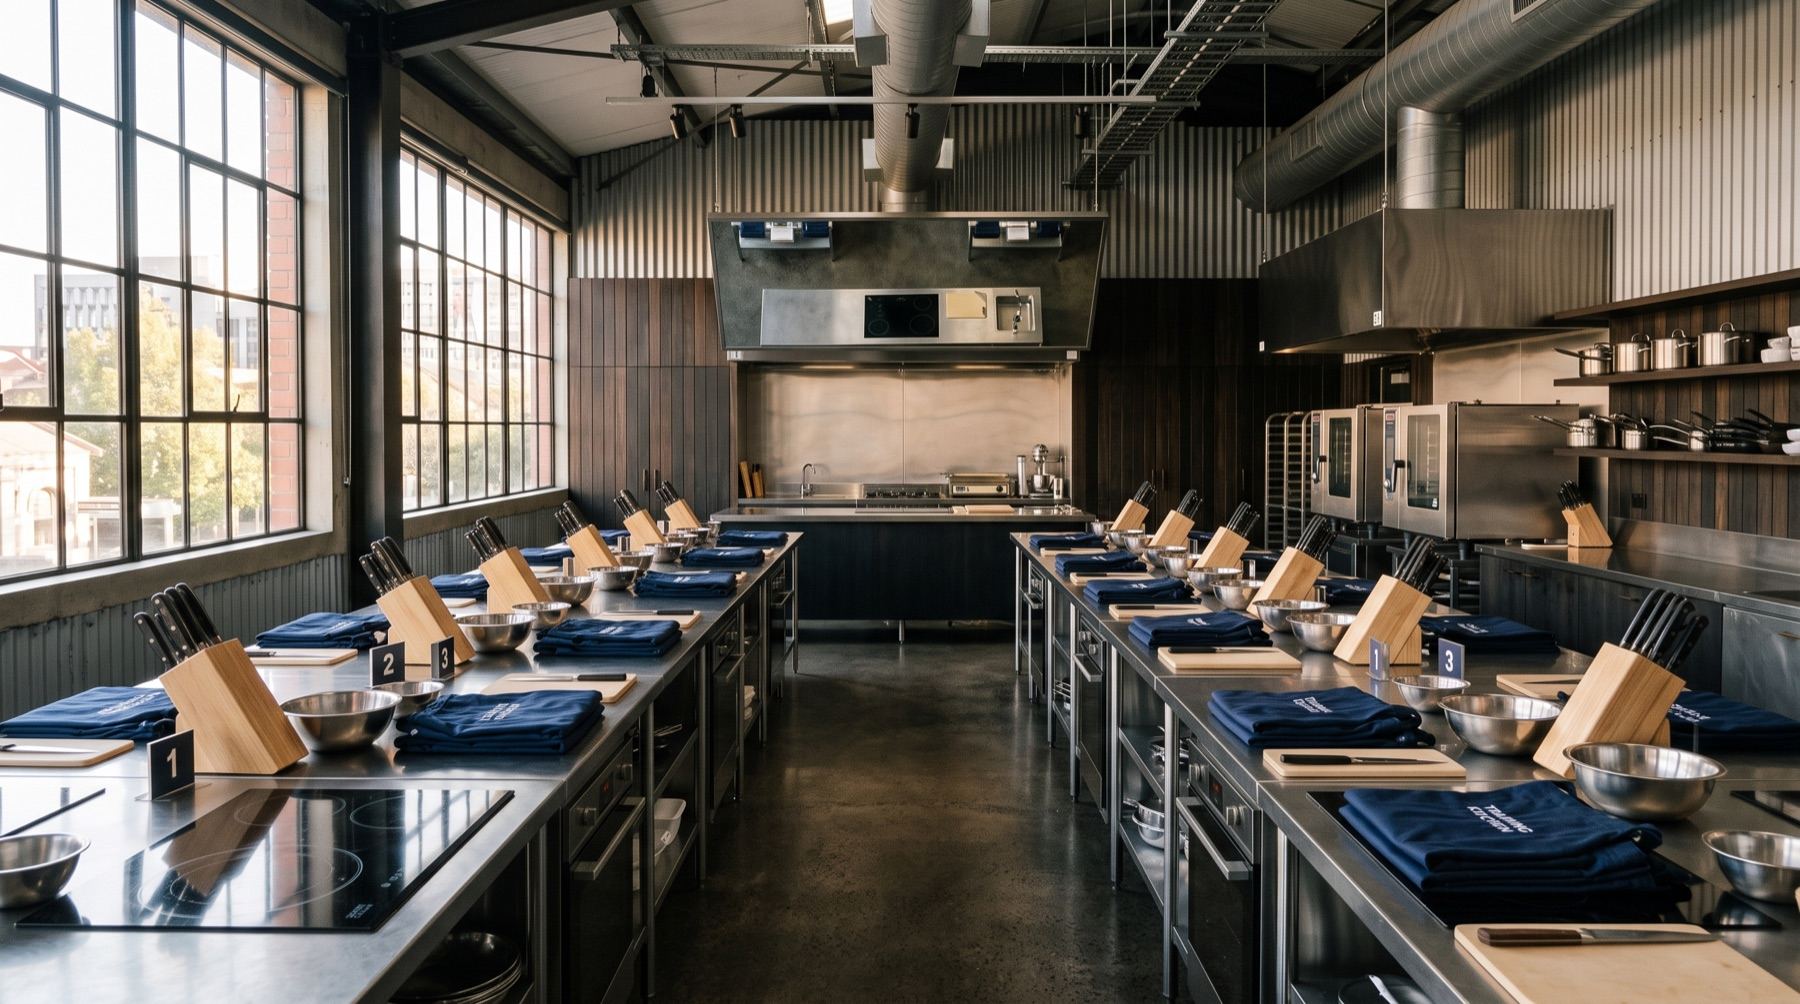
The driver pipeline. Queensland's Multi Combination licence requires at least twelve months on an HR or HC licence plus the TLIC4006 competency unit, so a new driver's realistic pathway to MC runs two to three years. No dedicated First Nations MC training program exists anywhere in the state (verified as a gap). The pillar funds that missing pipeline: 20 First Nations MC licensed drivers at scale, recruited in partnership with TMR's Cairns based Indigenous Driver Licensing Program, trained through the group's RTO pathway (Providence Education, RTO application in progress) once registration is achieved, and mentored in paid roles from day one. Drivers are not a workforce line item in this plan. They are the first cohort of owners in waiting.
Opex logic. The operating case rests on the energy wedge: electricity at roughly half the per kilometre energy cost of diesel (about $39 against $80 per 100 kilometres, verified comparison), reinforced by roughly 30 per cent lower maintenance reported in an ARENA supported Australian trial (verified, port duty cycle, applied cautiously). Depot solar at both ends deepens the wedge by putting the group's own generation under its own load. Against that stand a capital premium per truck (market estimate, unquoted) and the charging infrastructure above. The workbook models the crossover under conservative, central and favourable cases; none of it is presented as firm until OEM quotes and lane rate cards are in hand.
The rate promise and the pass through monitor. The service targets freight rates 20 to 30 per cent below prevailing diesel benchmarks on served lanes, consistent with the Masig pilot brief. That target is indicative until quotes and lane rate cards are obtained, because no public rate cards exist for these lanes (verified gap). What will not be indicative is the accountability: from the first delivery, the group will publish a shelf price pass through monitor, an independent quarterly basket survey in served communities, so that freight savings are traced to shelf prices in public. Cheaper freight that never reaches the register is not impact. The monitor is how funders, communities and the group itself will know the difference.
Pillar 2: The Sea
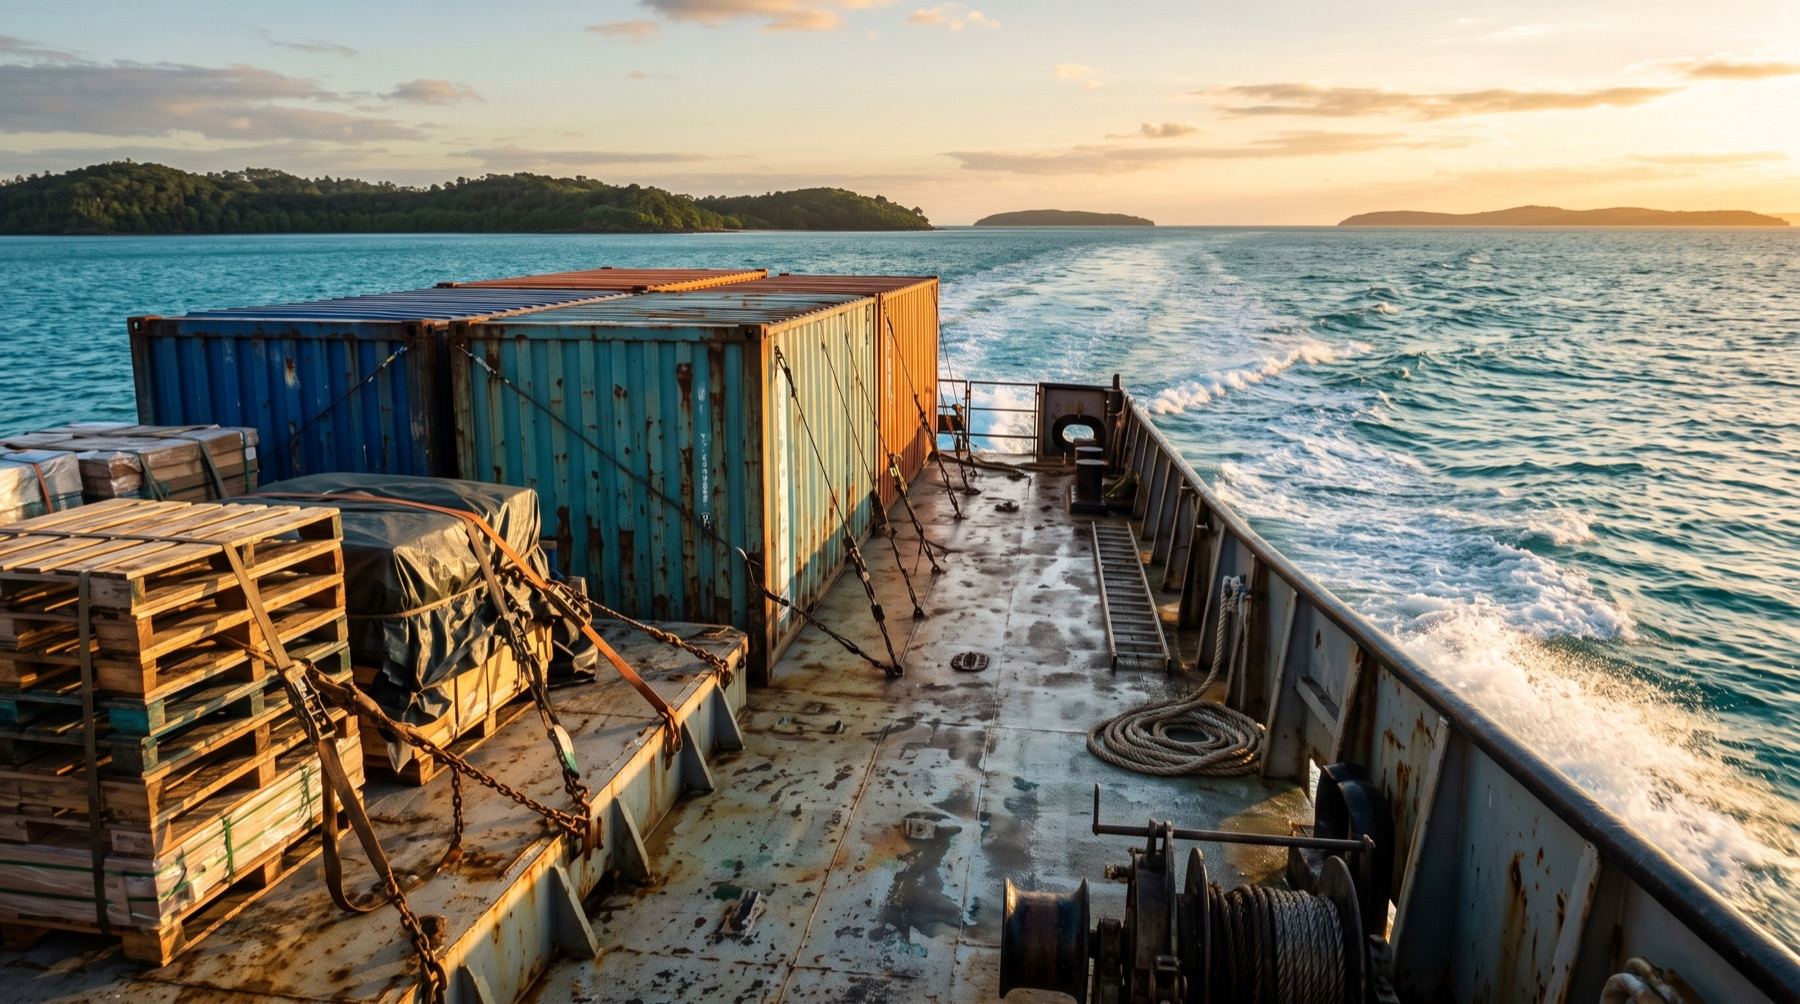
If the group could make only one intervention, it would be this one. Sea freight is where the monopoly lives, where the loop closes, and where the leverage is greatest. For stores served only by barge, freight is up to 39 per cent of the cost of goods, against 9 per cent for road served stores (verified, ALPA). Torres Strait prices run 35 to 40 per cent above the mainland, backlogs stretch to six to eight weeks at times, and there is one scheduled carrier (verified, TSRA testimony and ACCC). The last time this market had two operators, rates were held down by a two year price war (verified, ACCC merger record). One working vessel with a community mandate changes the negotiating position of every store in the strait. Two changes the market.
The monopoly is no longer my claim. It is the regulator's published finding.
Hunger by Design, Chapter 1
Market analysis. The demand is real, anchored and measurable. Community Enterprise Queensland, the statutory operator of the region's stores, posted $157.2 million in sales with 86 per cent Indigenous employment in remote operations in its audited 2024 to 25 review (verified). ALPA, Yolŋu owned and running community stores for more than fifty years, returned over $46 million to member communities last financial year (verified). Between them, and with 90 to 95 per cent of remote food bought at the community store (verified), store freight demand on this corridor is substantial, stable and contracted, exactly the demand profile a scheduled service needs. What is missing from the public record is total corridor tonnage; no source estimates it, and commissioning that demand study is a named Year 0 task rather than a number invented here. The government channel also exists: Queensland ran an expression of interest for outer Torres Strait sea freight services in late 2024 (QTenders 53433, closed November 2024). Its outcome is not public, and approaching TMR about it is a Year 0 action.
Partner or competitor, resolved. This plan competes with the monopoly carrier. It does not compete with the Indigenous organisations that run the stores. CEQ and ALPA are approached as anchor customers and partners, invited into service design, scheduling and, over time, governance. The distinction matters because the research flagged it as the first question a sceptical funder will ask: the corridor's retail layer already has strong Indigenous institutions, and this venture exists to serve them with the freight layer none of them owns. Their freight bills are the monopoly's revenue. Every dollar of rate reduction lands in their community returns.
The service gap is as important as the price gap. The incumbent's Queensland network runs a weekly linehaul from Cairns to Horn Island, where freight is transhipped to outer island landing craft on weekly to fortnightly loops (verified from published schedules). Fresh produce consumes its shelf life in transit and in transhipment. For the outer islands, a delayed barge means the store sells what the last barge brought. A single reported quote of $31,000 to move one truck from Cairns to Weipa became a regional talking point (reported, single anecdote, paired here with the verified levy series rather than standing alone). This is what an uncontested market does. It does not have to try.
The open contract channel. One more market fact is now on the record. Queensland ran an expression of interest for essential sea freight services to the outer Torres Strait in 2024. As at July 2026 its contract disclosure register shows no operator contracted, only a $514,600 advisory study into the operating model. The state has declared the need, paid to define the service, and signed nobody to run it. The model books no government contract revenue, so that contract is pure upside, and this plan intends to compete for it.
Service design. The service scales the architecture of the group's existing Masig hybrid vessel pilot work: a Cairns trunk, an anchor island call, then cluster extension. Masig (Yorke) Island is the founding community, with Masigalgal RNTBC as the native title counterparty shaping service design, vessel identity and equity before anything is signed. Masig has the fishery, the skill and the trade relationships. What it does not have is a way to keep the catch cold. The cold chain the community wants to build there would then create a southbound seafood return load the incumbent does not optimise for. That facility does not exist yet, and this plan does not assume it. Phase A operates one vessel proving the route: Cairns to the anchor call, focused on cold chain reliability and community partnership. Phase B adds the second vessel and cluster coverage across neighbouring island groups, lifting frequency and resilience. The phasing is the pilot's logic at scale: prove it with one community properly rather than promise ten communities thinly.
Vessels and capex. All figures indicative unless marked.
| Item | Cost | Basis |
|---|---|---|
| Vessel 1 acquisition and refit | $9.5M | Used hulls of 40 to 60 metres verified on market at $2M to $8.5M; refit to survey on top; a new build 57 metre vessel benchmarks about $11.5M |
| Vessel 2 acquisition and refit | $8.0M | Second hull, Phase B |
| Shore and island handling infrastructure | $3.0M | Cairns depot presence, island offloading equipment; council owned barge ramps are public infrastructure |
| Regulatory, survey and safety management establishment | $1.0M | AMSA survey, safety management system, certifications |
| Crewing pipeline and community equity process | $1.5M | Crew training pathway and the legal work of community ownership |
| Working capital and price response reserve | $8.0M | Sized to survive a sustained incumbent price response |
| Total | $31.0M |
Vessel prices are broker asking prices, not transactions, and condition determines everything; funds are committed only after survey and diligence, which is why acquisition sits behind the Year 0 gate.
Crewing and regulation. The regulatory pathway is genuinely favourable and verified. Voyages wholly within Queensland need no Commonwealth coastal trading licence. The vessels operate under AMSA's domestic commercial vessel system in Class 2 near coastal survey, and for vessels under 80 metres crewing is determined by the owner through the safety management system against AMSA's minimum tables, meaning the crew is costed from the roster we design. The service launches with general and refrigerated cargo; bulk fuel carriage, which demands tanker standards and a higher survey tier, is deferred as a later phase capability. Crewing is a First Nations pathway from the start: a TAFE partnered maritime training pipeline, island resident trainee positions, and rosters designed for community life. Torres Strait Islanders held these waters for millennia. The idea that the region's freight must be crewed and owned from elsewhere was never a fact about capability. It was a fact about who was allowed in.
The price response reserve, and why it is $8 million. The strongest evidence that entry works is also the clearest warning about what entry provokes: the two operator market of 2014 to 16 ended in a price war that drove the weaker operator out. The incumbent is backed by an institutional infrastructure fund, and the ACCC's undertaking constrains its contracts, not its prices. So the plan assumes the price response arrives, and budgets to outlast it: $8 million of working capital and reserve, anchor customer relationships that value reliability and ownership alongside rate, a cost base with no imperative to extract a fund return, and a public interest posture that makes predatory pricing a story the incumbent cannot afford to star in. If the incumbent instead cuts rates across the board and holds them down, communities win, which is the point.
The governance analogue. This model exists and works. Nunavut Eastern Arctic Shipping, majority Inuit owned with direct Inuit equity in the hulls, won the Government of Nunavut sealift contract covering 18 communities in 2019 in open competition against an entrenched incumbent (verified). Arctic sealift sustains multiple operators in a harsher, shorter season than the Torres Strait will ever have. NEAS is the reference point for the ownership structure, the community equity in vessels themselves, and the proof that an Indigenous owned carrier can win the anchor contract of its region.
Pillar 3: The Precinct
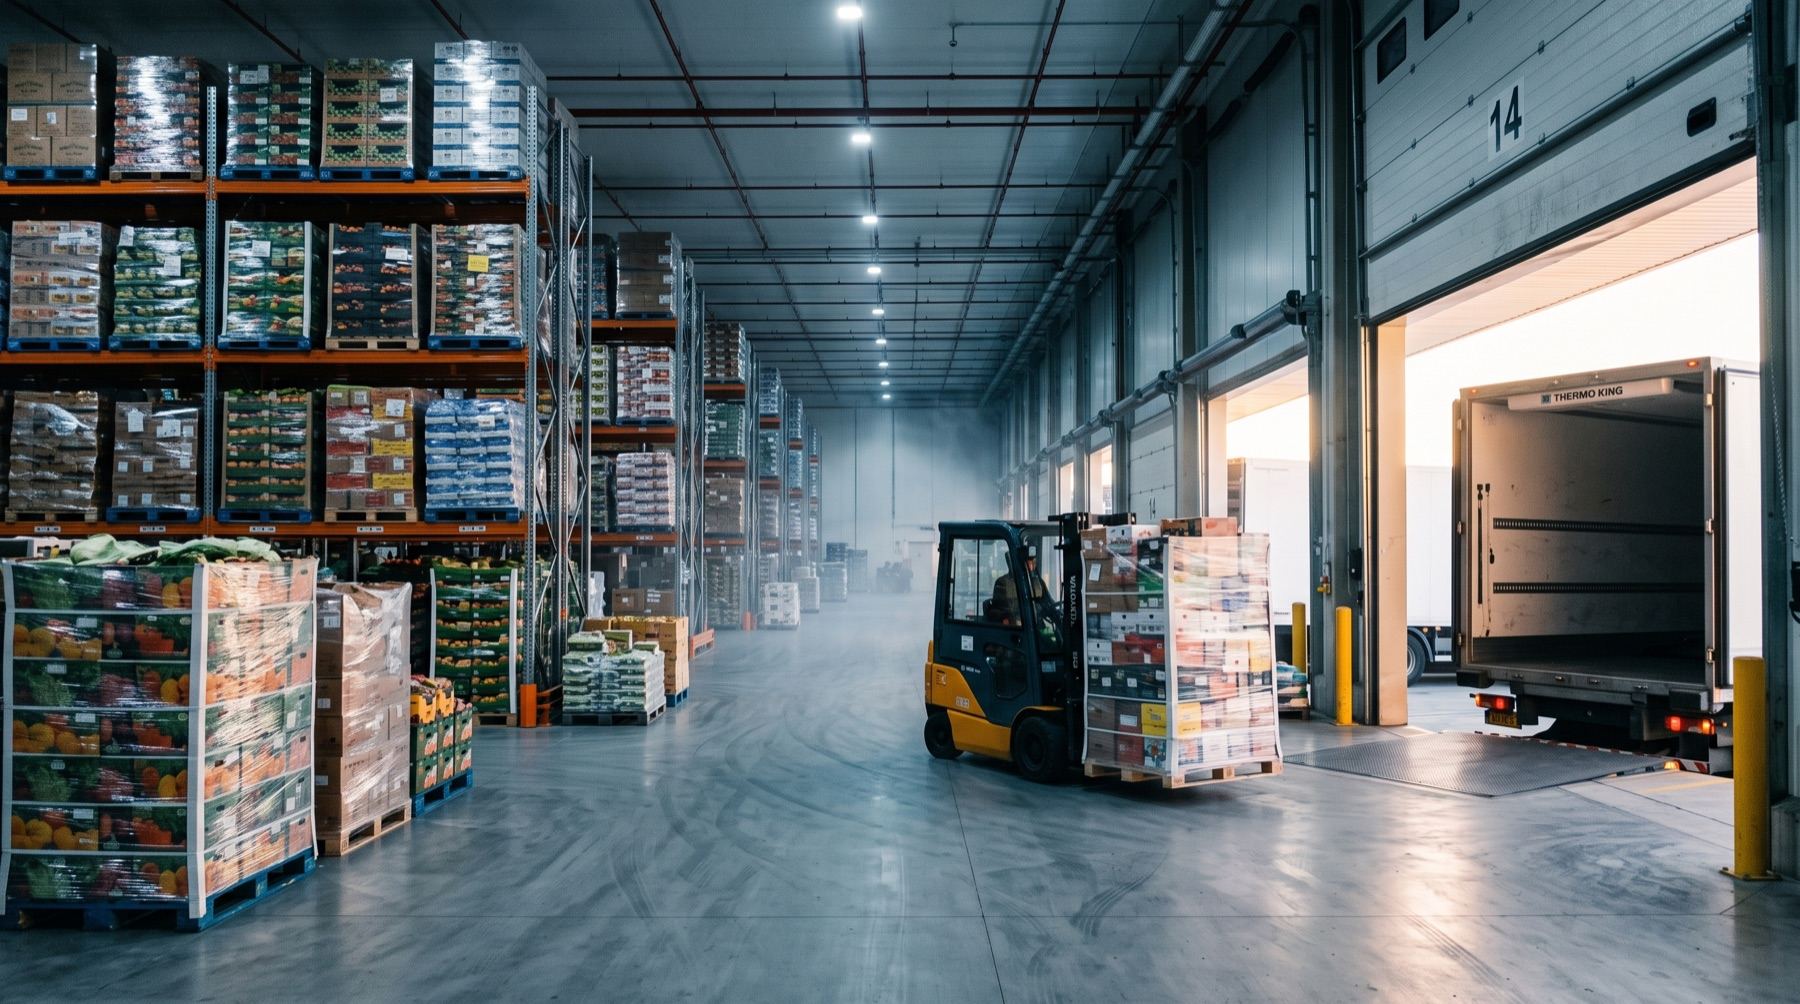 Cold storage
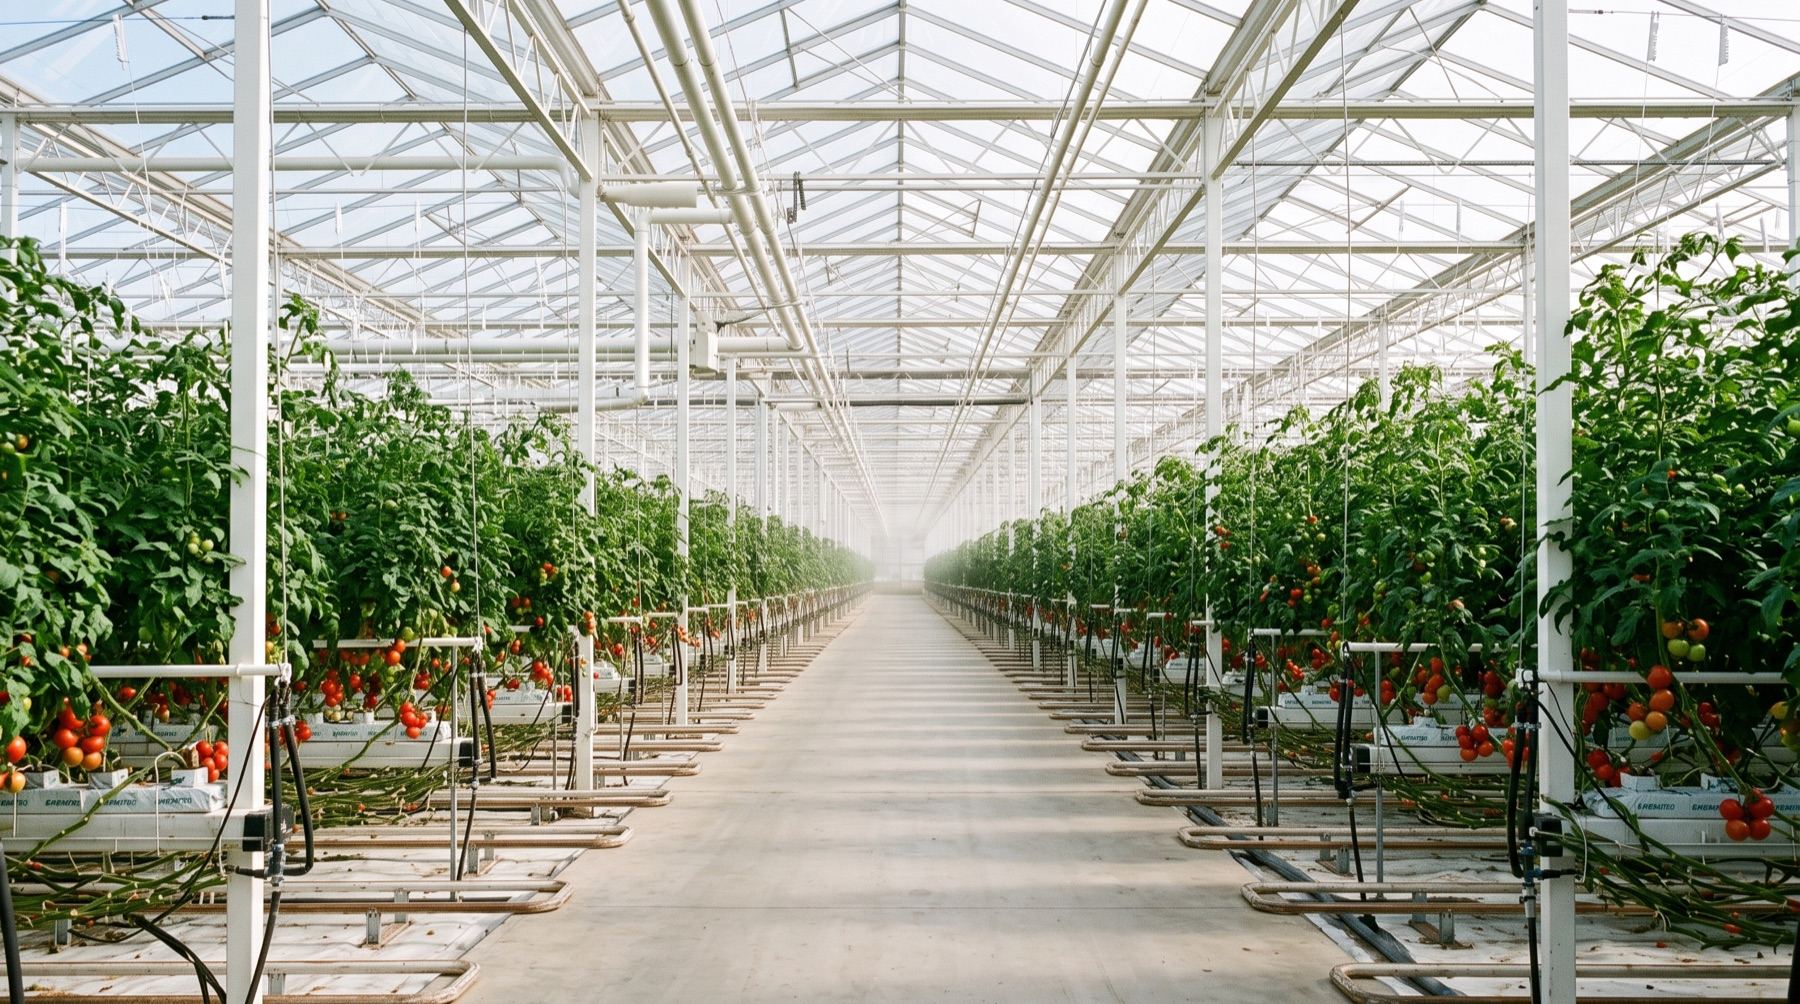 Under glass
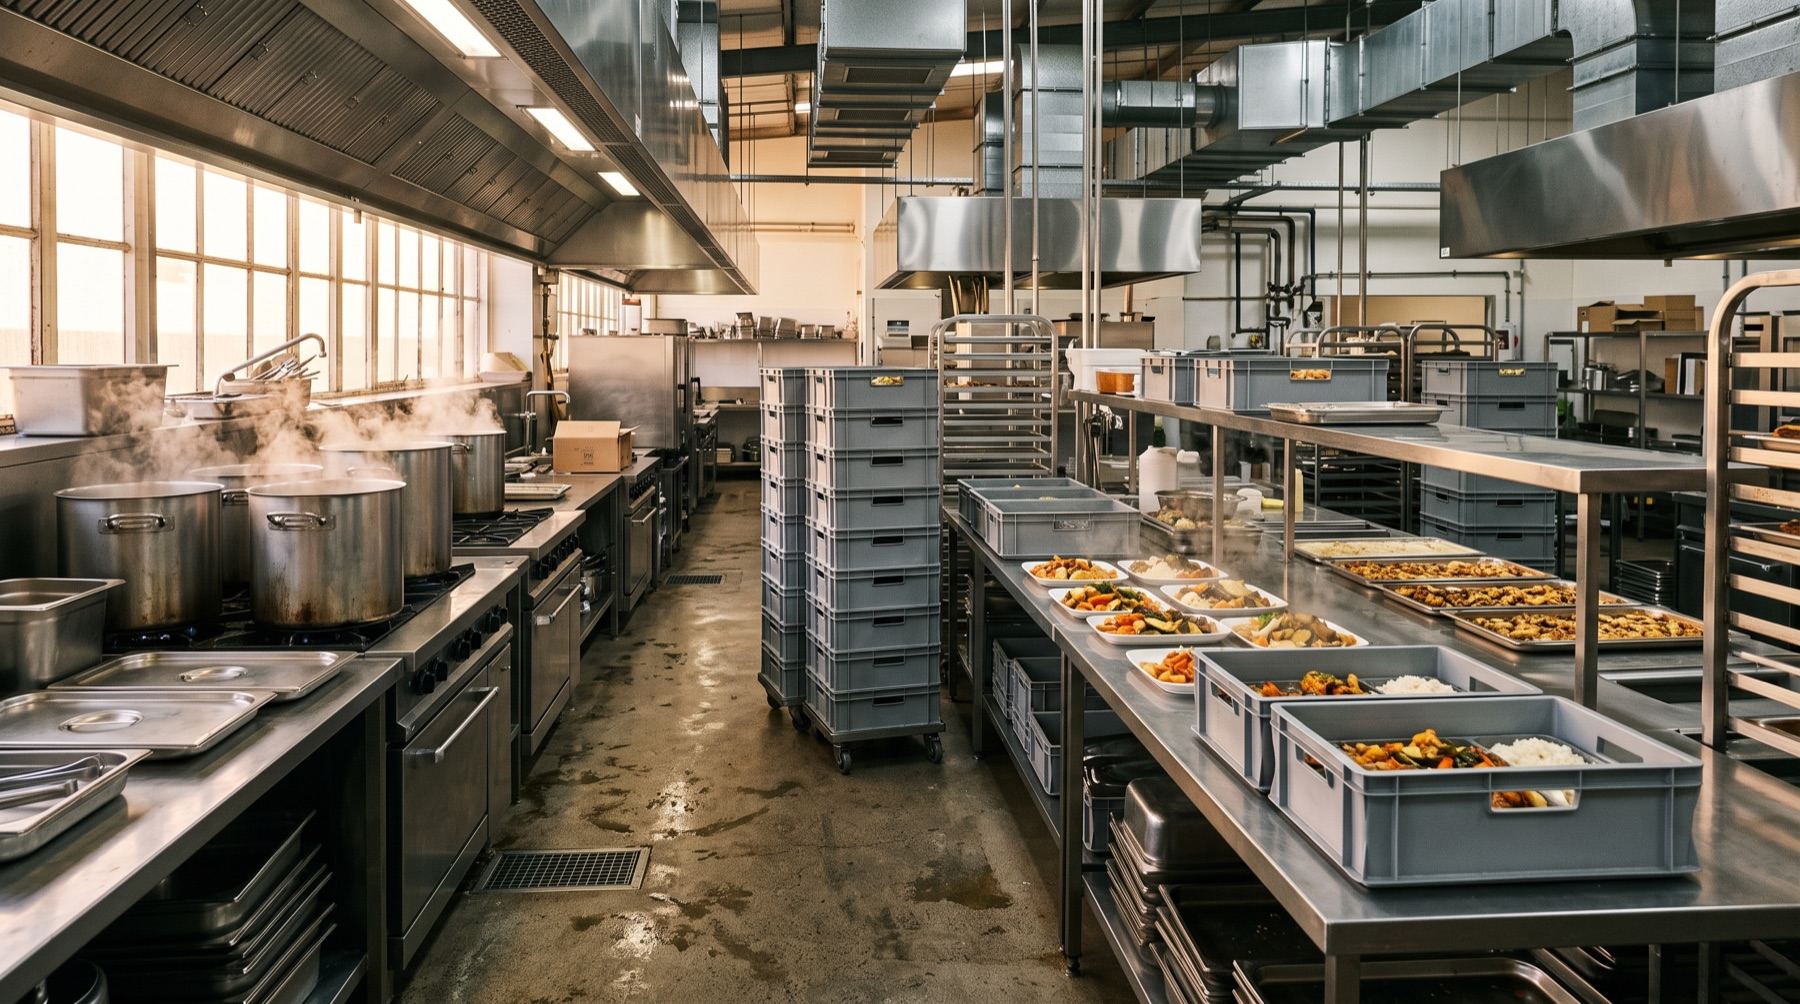 The kitchen
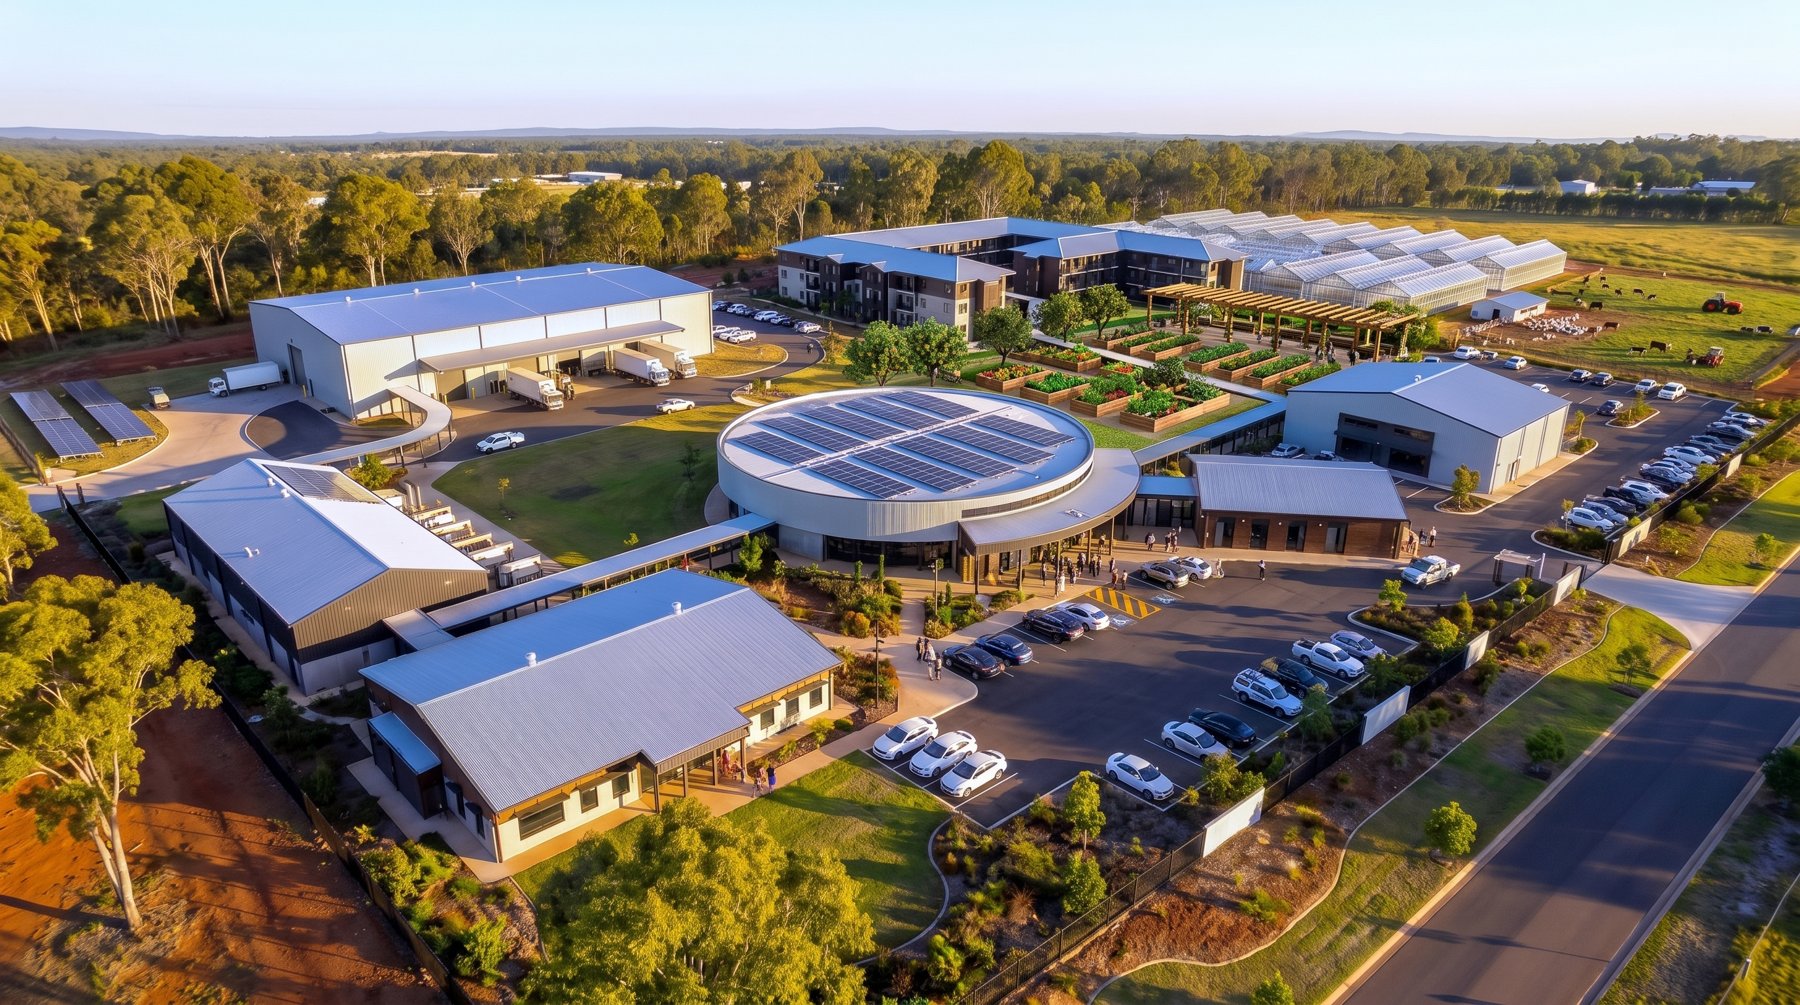
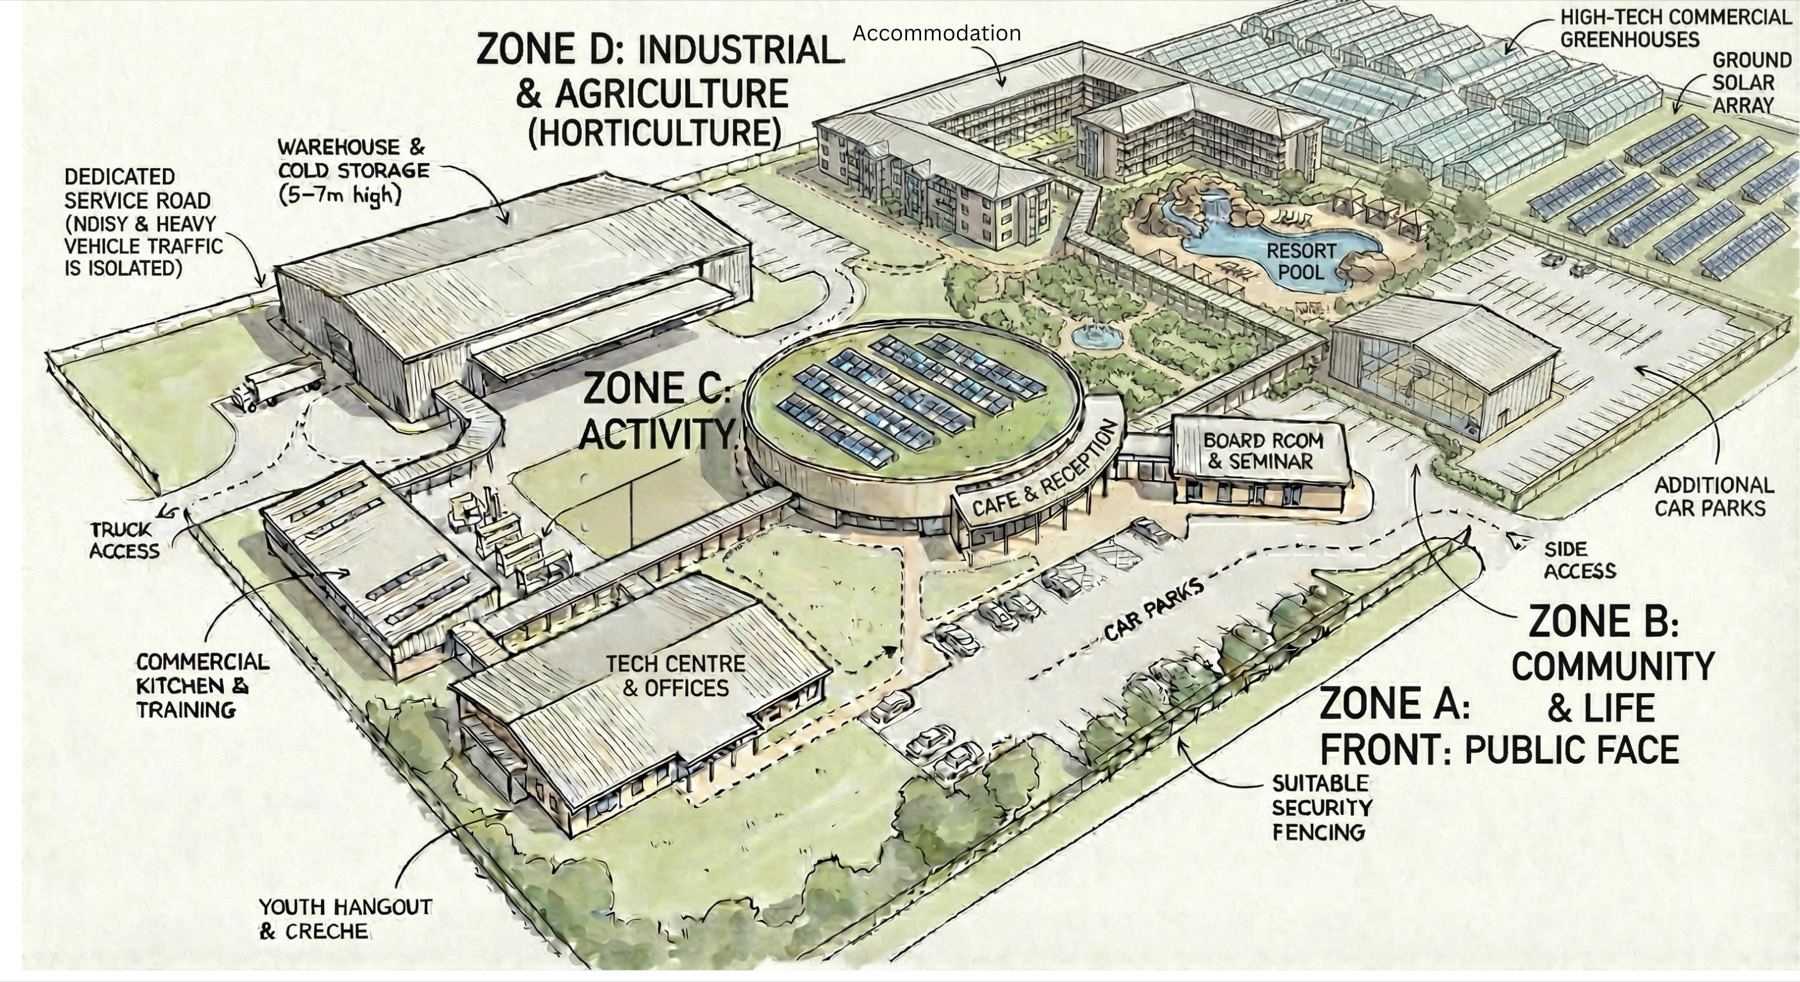
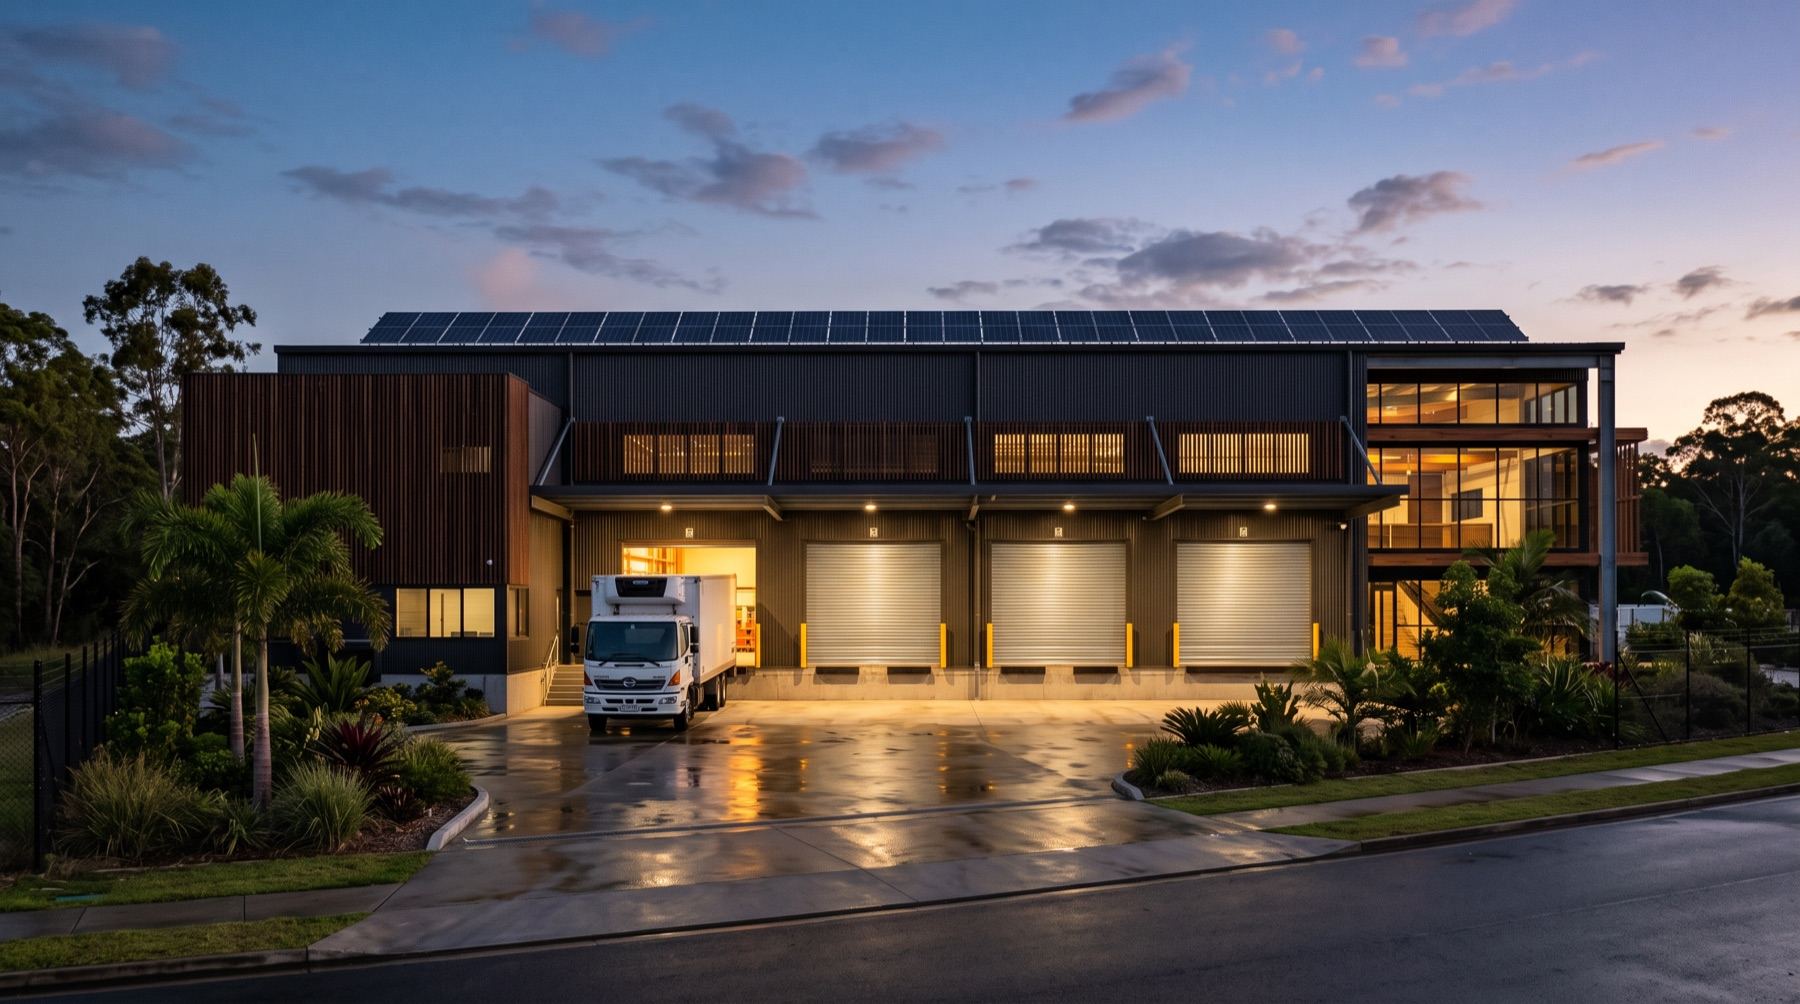
Freight alone breaks the monopoly; it does not build the balance sheet. The Precinct is where the group earns its independence: six to eight hectares in the northern Gold Coast corridor housing cold storage and logistics, high tech food production, a commercial kitchen, training rooms, offices, accommodation and a solar layer under all of it. It sits at the southern end of the corridor on purpose, close to Love Ya Corporate Catering's market, the corporate partner base and the donated food supply chain, while the Cairns depot under Pillar 1 holds the northern end. Trucks leave the precinct full of food and return full of product. Every zone feeds another. Freight in, food out, energy under all of it. That loop is the engine of the ten year model.
Zone by zone against the masterplan. The masterplan divides the site into four zones. Costings follow the capital plan; construction rates are verified 2024 to 26 Australian benchmarks, with the whole precinct subject to quantity surveyor pricing in Year 0.
Zone A, the public face. Arrival, reception and the cafe: the front door where corporate partners, schools and visitors meet the group's work, staffed through the training pipeline. Zone A elements are costed within the Zone C buildings line below.
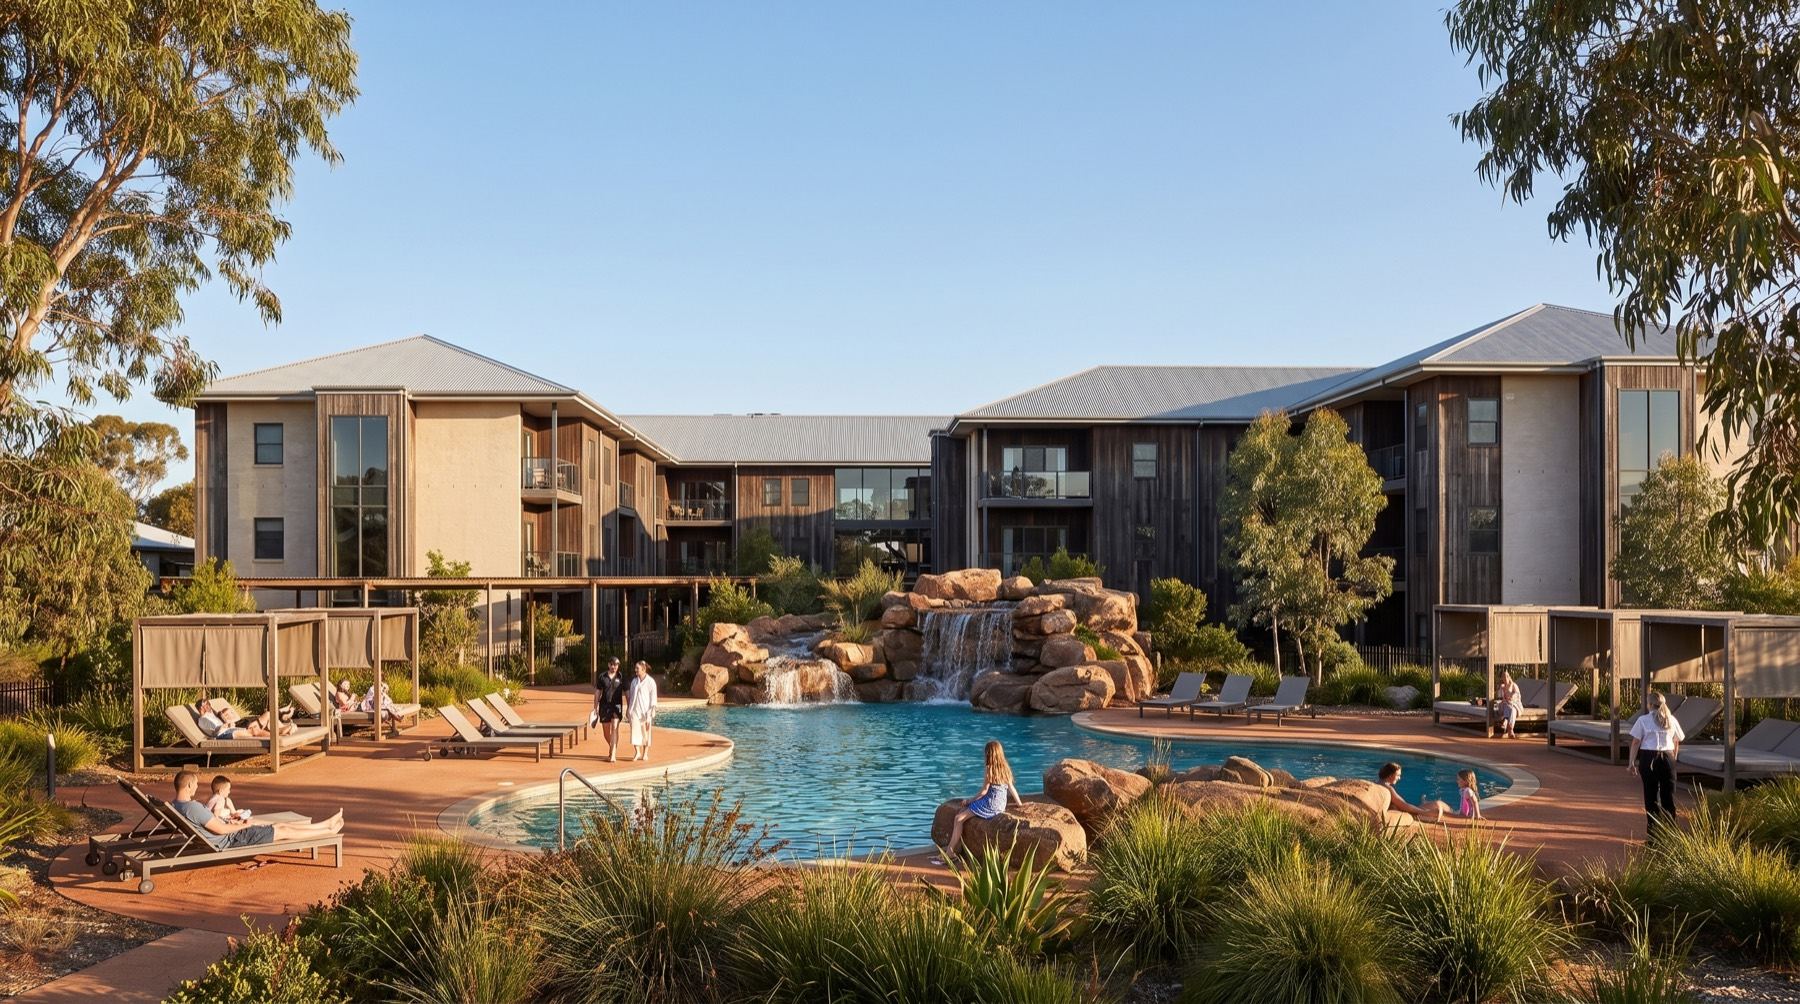
Zone B, community and life. Stage one delivers 34 rooms of accommodation at $5.0 million (indicative, against a verified benchmark of $120k to $180k per room for traditional build). It houses trainees from remote communities, visiting families, drivers on rotation and, over time, conference and tourism guests. The research flagged worker housing as an unsolved cost across the industry; this line solves it on our own land. The masterplan's full residential and resort vision, including pool and landscaping, belongs to stage two, funded from operations and stage two partners, not from the $100 million.
Zone C, activity. $10.0 million (indicative) across the working buildings: a commercial kitchen at $4.5 million modelled directly on FareShare's Brisbane facility, which was purpose built for about $4.5 to 5 million with capacity for five million meals a year (verified precedent); a tech centre and offices; the cafe and reception; boardroom and seminar spaces; and a youth hangout and creche so that training and work sit beside family life rather than apart from it. The FareShare model matters for its economics as much as its scale: one funded chef directing volunteer crews produced roughly 250,000 additional meals a year in the Brisbane kitchen (verified), and the kitchen's inputs pair donated surplus food with the precinct's own produce.
Zone D, industrial and agriculture. The revenue heart. A 4,000 square metre warehouse and cold storage facility at $6.5 million (indicative, against verified benchmarks of $500 to $1,500 per square metre ambient, $1,400 to $2,200 chilled, and $3,400 to $3,600 freezer, which is why the mix is priced by zone in the workbook). High tech greenhouses across 1.4 hectares at $7.5 million (indicative, against a verified benchmark of $4 million to $8 million per hectare). And 1.5 megawatts of ground and rooftop solar with storage at $2.5 million (indicative, against the verified GenCost utility benchmark of about $1,344 per kilowatt), charging the trucks, running the cold rooms and powering the kitchen. National cold storage demand is deeply undersupplied (verified, JLL), so the cold chain asset earns third party revenue from day one, not just group use.
| Zone D and site component | Cost |
|---|---|
| Land, 6 to 8 hectares, northern Gold Coast corridor | $6.5M |
| Zone D warehouse and cold storage, 4,000 sqm | $6.5M |
| High tech greenhouses, 1.4 ha | $7.5M |
| Ground and rooftop solar, 1.5 MW plus storage | $2.5M |
| Zone C buildings (kitchen, tech centre and offices, cafe and reception, boardroom and seminar, youth hangout and creche) | $10.0M |
| Zone B accommodation stage one, 34 rooms | $5.0M |
| Precinct total | $38.0M |
All indicative pending quotes; greenhouse benchmarks in particular are dated and unquoted, and the workbook flags them accordingly.
Revenue lines. The precinct carries five of the group's seven year ten revenue lines (modelled, indicative): catering and food products at $8.0 million, accommodation at $2.5 million, training at $1.5 million, tenancies at $0.8 million and energy at $0.9 million. Catering builds on Love Ya Corporate Catering's existing Supply Nation registered trade into a corporate market actively seeking Indigenous suppliers; procurement spend with Supply Nation registered businesses reached $5.83 billion in the 2024 to 25 financial year (verified).
Bush foods research and development. One number explains this program: First Nations people hold under 3 per cent of businesses in a native foods industry built entirely on their knowledge (verified). The precinct answers that directly with bush foods labs, propagation space in the greenhouses, and an incubation program for First Nations growers and brands, following the path NAAKPA proved, where a cooperative of six Aboriginal enterprises came to account for 30 to 40 per cent of national Kakadu plum production (verified). The point is not that the precinct grows bush foods. It is that First Nations businesses own what grows from them.
How the loop works, stated plainly. Freight in: the fleet and vessels feed the warehouse, and southbound backloads carry seafood and product to market. Food out: the greenhouses and kitchen turn freight capacity into meals, catering contracts and products carrying real margin. Energy under it all: the solar layer cuts the cost of every truck, cold room and oven above it. Training runs through every zone, so the precinct is simultaneously the group's revenue engine and the place where its future workforce is made. Assets that feed each other are what make a ten year path to self sufficiency more than a curve on a chart.
Capital plan
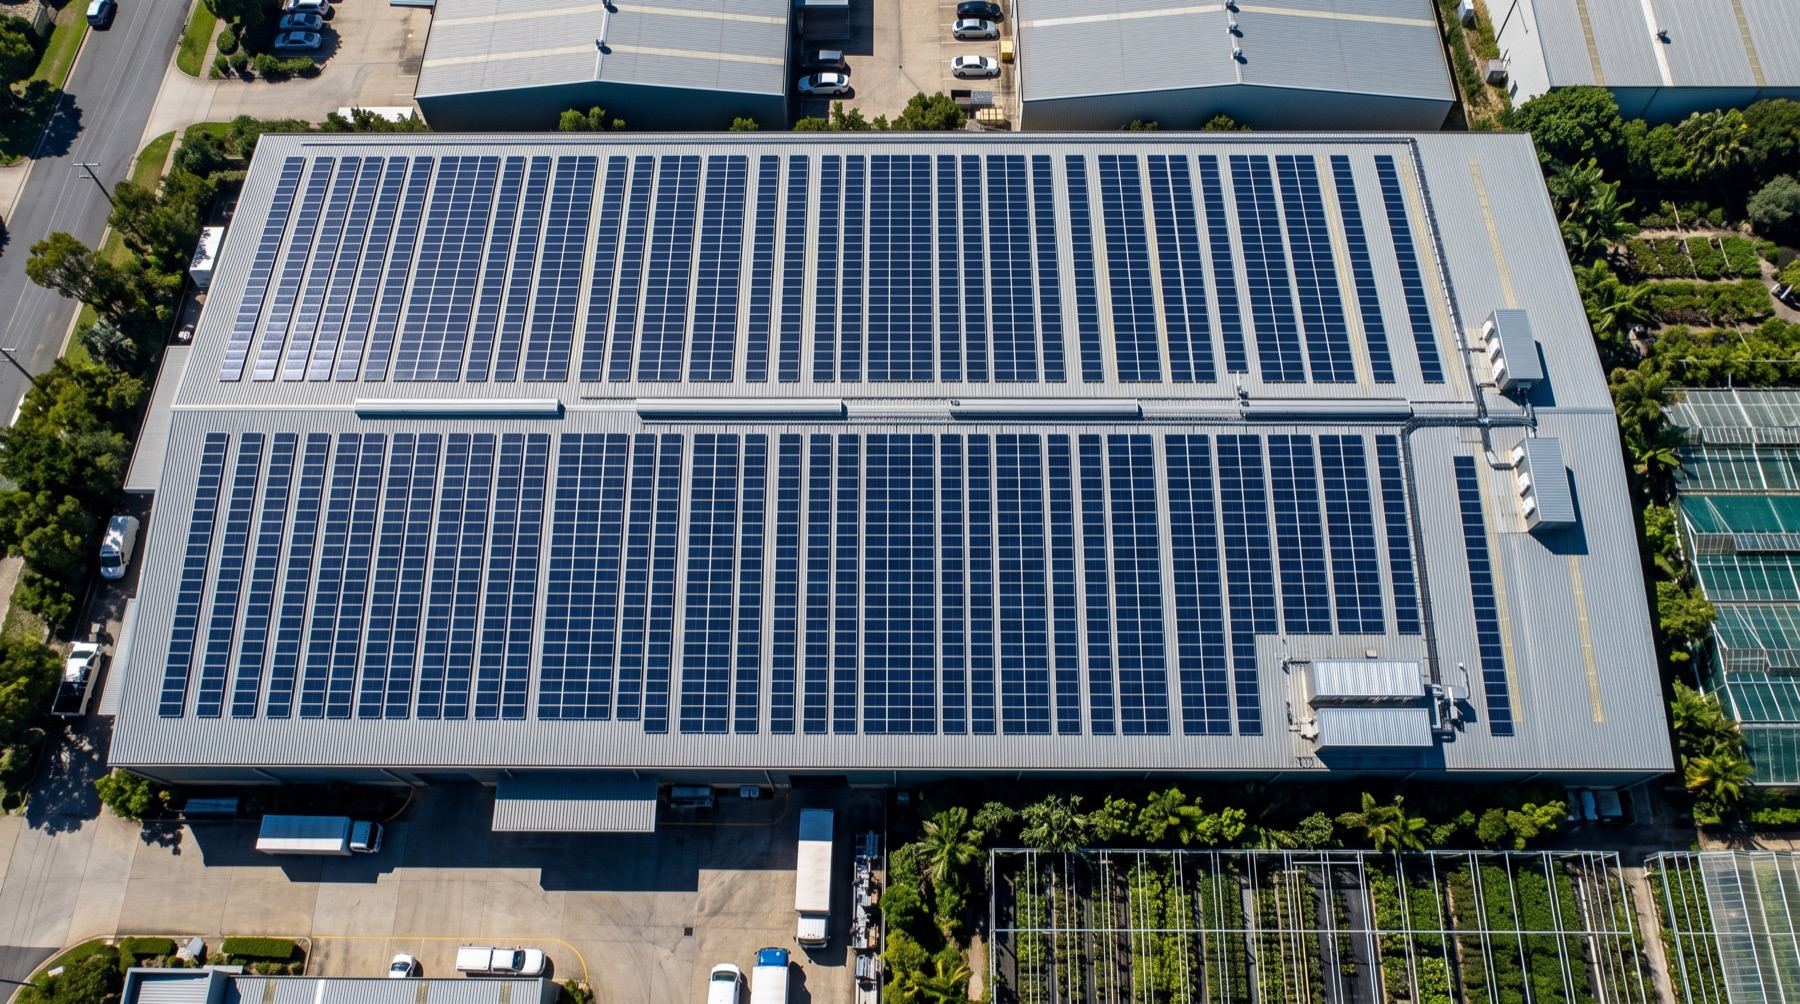
The $100 million allocates as follows. Component figures are indicative unless marked; the costings workbook holds every assumption with its source and confidence rating.
| Pillar | Total | Components |
|---|---|---|
| The Road | $21.0M | 10 battery electric prime movers $4.8M (about $480k each, market estimate; no OEM list prices); 12 refrigerated trailers with electric refrigeration units $2.7M; southern charging hub at the precinct $2.5M; Cairns depot and charging hub $5.5M; en route charging at two partner sites $3.0M; First Nations driver pipeline $1.0M; spares and fleet contingency $1.5M |
| The Sea | $31.0M | Vessel 1 acquisition and refit $9.5M; Vessel 2 acquisition and refit $8.0M (used hulls of 40 to 60 metres verified at $2M to $8.5M; new build 57 metre about $11.5M); shore and island handling infrastructure $3.0M; regulatory, survey and safety management establishment $1.0M; crewing pipeline and community equity process $1.5M; working capital and price response reserve $8.0M |
| The Precinct (Gold Coast) | $38.0M | Land 6 to 8 ha northern Gold Coast corridor $6.5M; Zone D warehouse and cold storage 4,000 sqm $6.5M (verified benchmarks: ambient $500 to $1,500 per sqm, chilled $1,400 to $2,200, freezer $3,400 to $3,600); high tech greenhouses 1.4 ha $7.5M (verified benchmark $4M to $8M per ha); ground and rooftop solar 1.5 MW plus storage $2.5M (verified benchmark about $1,344 per kW); Zone C buildings $10.0M (commercial kitchen $4.5M on the FareShare Brisbane model, tech centre and offices, cafe and reception, boardroom and seminar, youth hangout and creche); Zone B accommodation stage one 34 rooms $5.0M (verified benchmark $120k to $180k per room traditional build) |
| Capability, consultation, contingency | $10.0M | Community consultation and mandate $2.0M; IFF capability build over three years $3.0M; insurance reserve for cyclone zone assets $1.0M; program contingency $4.0M |
| Total | $100.0M |
Stage two sits outside the $100 million by design: accommodation expansion to the full masterplan including the resort pool and landscaping, a second tranche of greenhouses, and Peninsula Developmental Road electrification. It is funded from operations, debt (an Indigenous borrower precedent exists at NAIF, verified) and stage two partners in years 4 to 7.
The blended stack. No single funder writes this cheque, and the plan does not ask one to. The verified capacity behind each layer:
| Layer | Partner and verified capacity |
|---|---|
| Philanthropic cornerstone | Paul Ramsay Foundation: built on a bequest of about $3 billion, described by PRF as $4 billion; $1.513 billion in lifetime grants across 253 partners in its 2025 Annual Review; $220M to First Nations organisations since 2016; and an impact investing allocation of about $300M, which suits investment grade structures, not only grants |
| Concessional debt | NAIF: $4.3 billion committed, loans typically above $10M, an Indigenous borrower precedent on the books, and a required Indigenous Engagement Strategy this group exceeds by design |
| Energy capital | ARENA ($125M regional microgrid program including a $75M First Nations stream) and the CEFC, for the solar, storage and charging assets |
| Corporate partners | RAP aligned corporates whose procurement is already moving: Supply Nation registered business spend reached $5.83 billion in the 2024 to 25 year |
| State co investment | Queensland, whose own freight subsidy demonstrates a standing willingness to pay for remote freight cost relief, redirected here from recurrent subsidy to owned infrastructure |
Staged drawdown. Capital is drawn against the decision gates in Section 12, not on signature. Year 0 draws consultation and diligence funds only. Build funds draw after mandate and verified costings. Operating reserves draw at service launch. A funder can see every gate before the next dollar moves.
What the $100 million is, and is not. The $100 million is build capital. It is not the whole cash requirement. The operating ramp needs about $50 million of support across years 1 to 9 beyond the reserves already inside the capital plan, sized in Section 8 and in the workbook's cash position lines, and carried by the stack's operating layers: service contracts, subsidy redirection and philanthropic operating tranches. Stating that here, rather than letting diligence discover it, is the discipline this document runs on.
Ten year financial summary
The trajectory below is a model, and this section will not pretend otherwise. Its inputs are the workbook's sourced benchmarks, its structure is conservative, and its single most honest feature is the one already stated: the market's real prices are quote only, so the model's revenue lines carry confidence ratings, not certainty. The shape, however, is the plan.
Earned revenue as a share of group operating costs (modelled, indicative):
| Year | 1 | 2 | 3 | 4 | 5 | 6 | 7 | 8 | 9 | 10 |
|---|---|---|---|---|---|---|---|---|---|---|
| Share | 0% | 10% | 35% | 50% | 65% | 75% | 85% | 92% | 97% | 100%+ |
Years 1 and 2 are build years carried by capital. The steep climb through years 3 to 5 reflects services going live in sequence: road corridor first, Phase A vessel, then precinct revenue lines layering in. From year 8 the group approaches full cost recovery, and year 10 crosses it.
The ramp, stated plainly. A coverage ratio can hide a cash line, so here is the cash line. Summing the central case, operating costs exceed earned revenue by about $66 million across years 1 to 9 before year 10 turns positive. That number is in the workbook as a running total, not buried in a ratio. The capital plan already carries $17 million against it: the $8 million working capital and price response reserve, $4 million of program contingency, $3 million of capability build and $2 million of consultation funding. The balance, about $50 million across nine years and tapering to zero, is the ramp support the blended stack must carry alongside the build capital. Three things shorten it. Anchor service contracts, because the model books no government contract revenue and a single standing outer islands service contract would close a large share of the early gap. Subsidy redirection, because Queensland already spends recurrent money on remote freight relief and every dollar redirected into service payments on this infrastructure buys relief and an asset at once. And the gates themselves, because the staged rollout in Section 12 means a pillar's cost base does not open until its gate passes, so the deficit of a pillar that is not yet mandated is never incurred. A funder reading this section has seen the whole cash picture. That is the point of it.
Revenue lines at year 10 (central case, $M per year, modelled, indicative):
| Line | $M |
|---|---|
| Sea freight | 14.0 |
| Road freight | 8.0 |
| Catering and food products | 8.0 |
| Accommodation | 2.5 |
| Training | 1.5 |
| Tenancies | 0.8 |
| Energy | 0.9 |
| Total | ~35.7 |
Sensitivity narrative. The workbook stress tests five variables, and two dominate. First, incumbent price response: a sustained rate matching campaign compresses freight margins through years 2 to 5; the $8 million reserve, anchor contracts and the group's lower cost energy base are the counters, and the model's central case assumes rates settle below the pre entry trend rather than at our full target. Second, subsidy withdrawal, now verified in Queensland’s own budget papers rather than reported: the Remote Communities Freight Assistance Scheme fell from $29.4 million to $4.4 million in 2026 to 27 after the 20 per cent discount exhausted its envelope, and the successor Cape Freight Subsidy carries $19.6 million over three years and then ends in 2029. The model treats subsidy linked revenue as upside rather than base, so the cliff hurts communities more than it hurts the model, which is itself an argument for building infrastructure the budget cycle cannot switch off. The remaining three: wet season severity (a repeat of 27 week isolations raises intermodal costs and also raises the value of the service), construction escalation (met by contingency, staged procurement and quantity surveyor pricing before commitment), and insurance cost (reserved for separately, Section 10). A sober external benchmark keeps the model grounded: CEQ, the corridor's biggest retailer, runs an audited 4.2 per cent operating margin. Remote food economics are thin. The model earns its way to durability through owned energy, backloads and diversified precinct revenue, not through imagined freight margins.
Social return
Freight savings to communities. The target is freight rates 20 to 30 per cent below prevailing diesel benchmarks on served lanes (indicative until rate cards are obtained). The evidence that price relief changes lives is already in: when Queensland's remote freight discount rose to 20 per cent, remote healthy diet costs fell 24 per cent within a year (verified, peer reviewed). Structural competition aims to make that kind of fall permanent instead of budget dependent.
Enforceable, not asserted. The centrepiece of the social return case is the published price pass through monitor. The ACCC observed that some remote stores do not even display prices; impact claims in this sector are routinely unverifiable, and this project refuses to add to that pile. From first delivery, an independent quarterly basket survey across served communities will be published openly: the freight rate charged, the landed cost, the shelf price. Anchor customer agreements will carry pass through commitments. Community data is governed under CARE principles, with communities controlling what is shared and how. If the savings are not reaching shelves, everyone will see it, including us. That is what enforceable impact means.
Jobs and capability. 100 to 140 direct roles at scale across the fleet, vessels and precinct, majority First Nations (target, derived from the model). Within that: 20 First Nations MC licensed drivers through a pipeline that currently does not exist anywhere in Queensland; a maritime crewing pathway with TAFE partnership and island resident trainee positions; growers, cooks, cold chain operators and administrators through the precinct. Training runs through the group's RTO pathway (Providence Education, RTO application in progress), including a Certificate III in Food Security being developed for ASQA course accreditation, a qualification that would credential the exact workforce this infrastructure needs.
Health economics. First Nations people live with diabetes at 3.2 times the non Indigenous rate and die from it at 4.0 times (verified, AIHW). In remote NT communities, every dollar invested in primary care has been estimated to save $3.95 to $11.75 in hospital costs (verified), and food price is a primary lever on diet in communities where 90 to 95 per cent of food comes from the store. This case does not claim a precise health dollar figure; it claims the mechanism, which is documented, and commits to measuring the effect.
Social return on investment. Australian precedents put SROI for well governed Indigenous programs at 1.5 to 3.4 to 1 for Indigenous Protected Areas and 4.2 to 1 for a benchmark Indigenous employment program (both verified analyses). No SROI study exists for a remote food security infrastructure program; rather than borrow one, the group will commission a bespoke SROI in Year 0 so the baseline is set before the first asset operates.
Ownership as return. The under 3 per cent bush foods ownership figure, the zero First Nations owned maritime freight operators, the retail layer Indigenous run while the freight layer is not: these are the numbers this project moves. The deepest return is not a service delivered to communities. It is assets, wages, skills and equity that stay.
Risks
Presented in the order a sceptical funder should ask about them, led by the two the research elevated.
| Risk | The honest statement | Mitigation |
|---|---|---|
| Incumbent price response | The last two operator market in these waters ended in a two year price war that eliminated the weaker operator. The incumbent is institutionally backed, and the ACCC undertaking constrains contracts, not prices | An $8.0M working capital and price response reserve sized for a sustained response; anchor customers contracted on reliability, ownership and pass through, not rate alone; a lower operating cost base (owned energy, no fund return imperative); the undertaking prevents contractual lock in of customers during the fight; and public reporting that makes predatory pricing visible. If the incumbent holds prices down instead, communities keep the savings, which is the mission succeeding by other means |
| Cyclone zone insurance | Northern assets (vessels, island handling, Cairns depot) sit in cyclone country, and insurability of northern Australian assets is a known, worsening problem the research found unaddressed in most comparable plans | A dedicated $1.0M insurance reserve; broker engagement in Year 0 before asset commitment; the largest asset pool (the precinct) sited on the Gold Coast, outside the far northern cyclone belt; vessel class, survey and seasonal operating protocols; and exploration of parametric cover for wet season disruption |
| Consultation timing | Community consent moves at the speed of trust. Funding cycles do not. A mandate rushed to fit a drawdown schedule is not a mandate | Year 0 exists for this and is funded at $2.0M; the mandate is a hard gate, not a milestone date; soundings precede formal processes (the Masig pilot sequence); and the timeline flexes before the principle does |
| Subsidy withdrawal | The reported fall of Queensland's freight subsidy from $29.4M to $4.4M in 2026 to 27 would remove relief communities currently receive, and any model leaning on subsidy revenue would inherit that fragility | The model treats subsidy linked revenue as upside, not base; the venture's premise is exactly that structural cost removal must outlast subsidies; Budget Paper 4 verification is a Year 0 task before any reliance is priced |
| Construction escalation | Greenhouse benchmarks are dated and unquoted; cold storage rates vary sharply by specification; regional construction costs have escalated for three years | $4.0M program contingency plus line contingencies; quantity surveyor pricing and written quotes before commitment (Year 0); staged procurement so early packages inform later ones; benchmark ranges already carried at the cautious end |
| Execution capacity | IFF has not run a $100M program. Funders should ask, and this document answers rather than deflects | $3.0M IFF capability build across three years; named partners with operating track records (Love Ya Corporate Catering trading since before this plan; The Established Ventures; Fortified & Co); experienced freight, maritime and construction operators recruited into delivery roles; governance and gates below; and a staged plan in which no stage begins until the prior gate is passed |
| Demand quantification | No public source estimates total corridor freight tonnage, so fleet and revenue sizing rest on anchored proxies (store sales, subsidy volumes) rather than a measured market | A commissioned freight demand study in Year 0; anchor customer letters of intent before vessel purchase; Phase A designed to generate real demand data before Phase B commits |
| Wet season severity | The 2024 to 25 season isolated Kowanyama for 27 weeks, a record; climate trends point longer, not shorter | Intermodal design with owned sea capacity; cold storage buffers at both ends of the corridor; service level design that plans for isolation rather than hoping against it |
| Grid and site feasibility | Charging hubs and precinct loads need network connection capacity that is not yet confirmed; land tenure for northern sites involves native title and DOGIT processes that cannot be shortcut | Network operator connection studies commissioned in Year 0; tenure diligence and traditional owner engagement built into the mandate process itself, not appended to it |
Governance
Lead entity. Indigenous Futures Foundation leads: a registered charity with deductible gift recipient status, with Jaway as its trading name. Australian law is settled that a charity can own trading businesses whose profits serve its purpose, and the sector's strongest example is already in this corridor's story: ALPA, simultaneously a CATSI corporation and a registered charity, has run commercial supermarkets for over fifty years and returned more than $46 million to member communities last financial year (verified). The structure this plan proposes is well trodden ground.
The operating group. Love Ya Corporate Catering, Supply Nation registered, is the trading arm and the commercial engine of the precinct's catering line. Providence Education is the group's RTO pathway; its RTO application is in progress, and the Certificate III in Food Security is being developed for ASQA course accreditation. Until registration is achieved, training delivery is described as a pathway, never as a promise. Fortified & Co and The Established Ventures are named partners bringing commercial and delivery capability alongside IFF.
Community mandate as a hard precondition. Nothing is built without a documented mandate from the communities each asset serves. This carries over the M1 discipline from the group's Maritime Freight Venture planning: free, prior and informed consent processes led by the recognised native title bodies (for the sea pillar's founding community, Masigalgal RNTBC), formal engagement with the regional councils and authorities, and a mandate recorded before capital commits. Consultation is funded properly at $2.0 million because consent done cheaply is consent done badly.
CATSI pathway to community equity. As pillar assets localise, ownership moves to communities through corporations registered under the CATSI Act, the structure that lets a community hold the ownership layer while charity registration preserves the concessional settings. The governance template is ALPA's: community directors drawn from member communities, advisory committees on the ground, and a succession pipeline. The sea pillar follows the NEAS precedent of direct community equity in the hulls themselves. The intended end state is not IFF owning infrastructure that serves communities. It is communities owning infrastructure, with IFF as steward of the transition.
Data sovereignty. All community, route and usage data is governed under CARE principles. Communities control what is collected about them and what is shared, including with funders. The price pass through monitor publishes system performance, not community surveillance.
What funders require, pre cleared. NAIF requires an Indigenous Engagement Strategy; this plan is one. PRF's First Nations funding requires First Nations led governance; IFF's board and leadership meet it. ARENA's First Nations stream emphasises genuine ownership and decision making; community equity is the design, not a feature. Independent evaluation is budgeted, and the annual report will publish Indigenous employment and procurement outcomes against targets.
Staged rollout
The plan is staged so that every stage buys information, and every gate is a genuine decision, not a formality.
Year 0: consultation and mandate. Community soundings, then formal consent processes with native title bodies, councils and store operators. In parallel, the diligence sprint that converts indicative numbers to firm ones: OEM and trailer quotes; vessel broker engagement and surveys; freight lane rate cards; the commissioned demand study; quantity surveyor pricing for the precinct; grid connection studies; insurance broker engagement; purchase of the incumbent's ASIC financial reports; TMR approached on the 2024 sea freight EOI outcome; Queensland Budget Paper 4 verification. Gate 1: documented community mandate plus a verified costings workbook. No mandate, no build. No quotes, no purchase.
Years 1 to 2: build. Precinct land secured and Zone D and Zone C construction begun; Vessel 1 acquired, refitted and surveyed; the first tranche of trucks ordered from Wacol; charging hubs built; the driver and crew pipelines enrolled; anchor customer agreements signed. Gate 2: certificates of survey and operation in hand, corridor service live, pass through monitor publishing.
Years 3 to 5: operate and scale. Phase B: Vessel 2 and cluster coverage. Precinct revenue lines layer in: kitchen, catering, accommodation stage one, tenancies, energy. Earned revenue climbs from 35 to 65 per cent of operating costs (modelled). First CATSI equity structures established with founding communities. Gate 3: sustained service reliability, audited results tracking model, community equity transfers begun.
Years 6 to 10: self sustaining. Earned revenue passes full cost recovery by year 10 (modelled). Stage two proceeds from operations, debt and stage two partners: accommodation expansion, second greenhouse tranche, and PDR electrification as sealing and charging allow. Community equity deepens towards the end state. The group's story stops being a funded project and becomes what it was always meant to be: infrastructure that communities own, run and answer for themselves.
The loop doesn't break itself. You break it. Or you maintain it. There is no third option.
Hunger by Design, Chapter 1
Appendices
A. Costings workbook. Every capital and operating assumption, line by line, each carrying its source, its date and a confidence rating of verified, derived or indicative. The workbook is the living version of this document's numbers and is updated as Year 0 quotes land.
B. Research reference library. The 151 consolidated references behind this case, built from 156 findings and a July 2026 source hardening pass across six research sweeps: the evidence base, electric freight, maritime, the precinct, funding and governance, and communities and routes, together with the verification critique that corrected this document before it could mislead anyone.
C. The precinct masterplan. The zone by zone plan for the Gold Coast site, from the public face at the front gate to the greenhouses at the back fence.
Prepared by Indigenous Futures Foundation, July 2026. Every figure in this document is labelled verified, derived or indicative, and the labels are the point. We would rather show a funder an honest range than a confident fiction. The communities this plan serves have been shown confident fictions for twenty six years.
The loop does not break itself.
Every figure in this document is labelled verified, derived or indicative. Nothing indicative is presented as firm. No invented references, anywhere.